

Question: The data show the per capita energy consumptions (in millions of Btu) and the per capita gross national incomes (in thousands of U.S. dollars) for
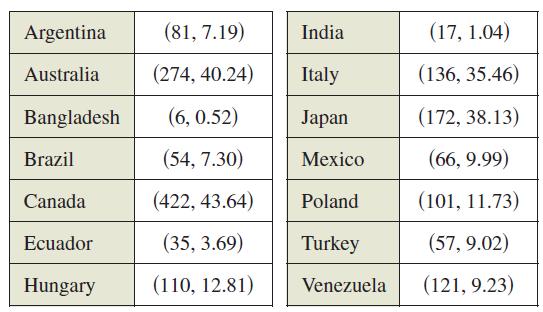
The data show the per capita energy consumptions (in millions of Btu) and the per capita gross national incomes (in thousands of U.S. dollars) for several countries in 2008.
(a) Use the regression capabilities of a graphing utility to find a linear model for the data. What is the correlation coefficient?
(b) Use a graphing utility to plot the data and graph the model.
(c) Interpret the graph in part (b). Use the graph to identify the three countries that differ most from the linear model.
(d) Delete the data for the three countries identified in part (c). Fit a linear model to the remaining data and give the correlation coefficient.
Argentina Australia Bangladesh Brazil Canada Ecuador Hungary (81, 7.19) (274, 40.24) (6, 0.52) (54, 7.30) (422, 43.64) (35, 3.69) (110, 12.81) India Italy Japan Mexico Poland Turkey Venezuela (17, 1.04) (136, 35.46) (172, 38.13) (66, 9.99) (101, 11.73) (57, 9.02) (121, 9.23)
Step by Step Solution
3.52 Rating (166 Votes )
There are 3 Steps involved in it
a b c Greater per capita energy consumption by a country ... View full answer

Get step-by-step solutions from verified subject matter experts