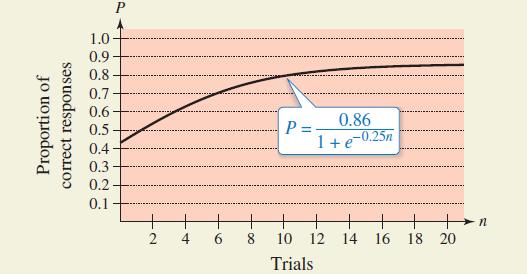
The graph shows the proportion P of correct responses after n trials in a group project in
Question:
The graph shows the proportion P of correct responses after n trials in a group project in learning theory.

(a) What is the limiting proportion of correct responses as n approaches infinity?
(b) What happens to the rate of change of the proportion
in the long run?
Transcribed Image Text:
Proportion of correct responses 1.0 0.9 0.8 0.7 0.6 0.5 0.4 0.3 0.2 0.1 P + + 2 ++ 4 + 6 P=- 8 10 0.86 1 + e-0.25n 12 14 Trials + + + 16 18 20 n
Fantastic news! We've Found the answer you've been seeking!
Step by Step Answer:
Answer rating: 66% (15 reviews)
a b...View the full answer

Answered By

JAPHETH KOGEI
Hi there. I'm here to assist you to score the highest marks on your assignments and homework. My areas of specialisation are:
Auditing, Financial Accounting, Macroeconomics, Monetary-economics, Business-administration, Advanced-accounting, Corporate Finance, Professional-accounting-ethics, Corporate governance, Financial-risk-analysis, Financial-budgeting, Corporate-social-responsibility, Statistics, Business management, logic, Critical thinking,
So, I look forward to helping you solve your academic problem.
I enjoy teaching and tutoring university and high school students. During my free time, I also read books on motivation, leadership, comedy, emotional intelligence, critical thinking, nature, human nature, innovation, persuasion, performance, negotiations, goals, power, time management, wealth, debates, sales, and finance. Additionally, I am a panellist on an FM radio program on Sunday mornings where we discuss current affairs.
I travel three times a year either to the USA, Europe and around Africa.
As a university student in the USA, I enjoyed interacting with people from different cultures and ethnic groups. Together with friends, we travelled widely in the USA and in Europe (UK, France, Denmark, Germany, Turkey, etc).
So, I look forward to tutoring you. I believe that it will be exciting to meet them.
3.00+
2+ Reviews
10+ Question Solved
Related Book For 

Question Posted:
Students also viewed these Mathematics questions
-
in a group project whose sole purpose is CRM has to come up with a budget. The group is part of a small cafe renovation project . Other than Salesforce software what else is important for CRM to...
-
The following cluster bar graph shows responses from different age groups to questions regarding connectivity and tracking technology found in new cars. A recent Harris Poll asked respondents how...
-
Change your answer in Group Project 2 to include foreign travel. How does the use case and use case scenario change?
-
Simplify each expression in Problems 722. Classify each answer by number of terms and degree. (x + 2y3z) - (x - 5y + 4z)
-
A sample of seven passengers boarding a domestic flight produced the following data on weights (in pounds) of their carry-on bags. a. Using the formula from Chapter 3, find the sample variance, s2,...
-
Appreciate the difference between the target population and the sampling frame.
-
3. What does the Item List show?
-
In Problem 12.7 on page 424, you used the plate gap on the bag sealing equipment to predict the tear rating of a bag of coffee. The data are stored in Starbucks. a. Construct a 95% confidence...
-
I. Answer true or false and comment briefly if necessary (4.5 points). A. Debt holders generally have preferred claims on the firms assets compared to equity in- vestors. C. Vacancy is taken out of a...
-
Dwayne Johnson refinances his current home mortgage with Rock Mortgage Corp. At the closing, he compares his Closing Disclosure to the Loan Estimate he was given shortly after he applied for the...
-
Assume that you can earn 6% on an investment, compounded daily. Which of the following options would yield the greatest balance after 8 years? (a) $20,000 now (b) $30,000 after 8 years (c) $8000 now...
-
In Exercises complete the table by determining the amount of money P (present value) that should be invested at rate r to produce a balance of $100,000 in t years. r = 2% Compounded daily t P 1 10 20...
-
Identify the state of the bond market (equilibrium, shortage, surplus), given each of the following: (a) Shortage in the money market (b) Surplus in the money market (c) Equilibrium in the money...
-
While sovling y' = Ky(Ay), we used the fact that 1 y(1) 1 1 - y y-A Use partial fraction decomposition (and a bit of algebra) to show that this is true. 1) Use partial fractions. Do not merely...
-
You are fluent in three languages. In terms of your strengths, this is an example of what? a. Personal brand b. Vocation c. Experience d. Competency
-
Miller Company's contribution format income statement for the most recent month is shown below: Sales (45,000 units) Variable expenses Contribution margin Fixed expenses Net operating income...
-
Find f''(x). f(x) = (x+8) 5 f''(x) =
-
How does the market play into business financials? 2- How do stocks and bonds play into the future of the organization? 3- What is the future value of money and what is it used for? 4- What is a...
-
A truck rental company rents a moving truck for one day by charging $29 plus $0.20 per mile.Write a linear equation that relates the cost C, in dollars, of renting the truck to the number x of miles...
-
Audrey purchases a riding lawnmower using a 2-year, no-interest deferred payment plan at Lawn Depot for x dollars. There was a down payment of d dollars and a monthly payment of m dollars. Express...
-
Compute the following definite integrals and compare with your answer from the earlier problem. Compare with Section 4.4, Exercises 12 and 20. I+ d
-
The upward acceleration is 2.0 m/s2 and it has 60 seconds worth of fuel. Two rockets are shot from the ground. Each has a different upward acceleration, and a different amount of fuel. After the fuel...
-
Compute the following definite integral. 101 +6r dt
-
thumbs up if correct A stock paying no dividends is priced at $154. Over the next 3-months you expect the stock torpeither be up 10% or down 10%. The risk-free rate is 1% per annum compounded...
-
Question 17 2 pts Activities between affiliated entities, such as a company and its management, must be disclosed in the financial statements of a corporation as O significant relationships O segment...
-
Marchetti Company, a U.S.-based importer of wines and spirits, placed an order with a French supplier for 1,000 cases of wine at a price of 200 euros per case. The total purchase price is 200,000...

Study smarter with the SolutionInn App


