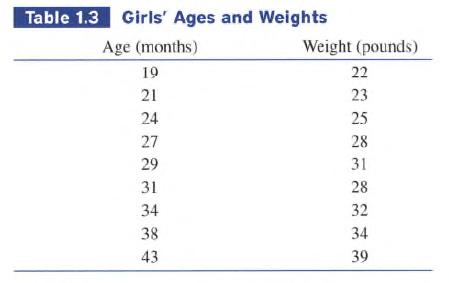
Table 1.3 lists the ages and weights of nine girls. (a) Find the linear regression equation for
Question:
Table 1.3 lists the ages and weights of nine girls.

(a) Find the linear regression equation for the data.
(b) Find the slope of the regression line. What does the slope represent?
(c) Superimpose the graph of the linear regression equation on a scatter plot of the data.
(d) Use the regression equation to predict the approximate weight of a 30-month-old girl.
Fantastic news! We've Found the answer you've been seeking!
Step by Step Answer:
Related Book For 

Calculus Graphical, Numerical, Algebraic
ISBN: 9780132014083
3rd Edition
Authors: Ross L. Finney, Franklin D. Demana, Bert K. Waits, Daniel Kennedy
Question Posted:


