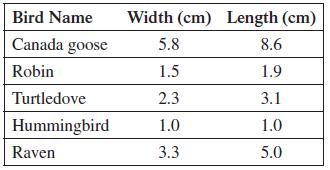
The average length and width of various bird eggs are given in the following table. (a) Plot
Question:
The average length and width of various bird eggs are given in the following table.

(a) Plot the points, putting the length on the y-axis and the width on the x-axis. Do the data appear to be linear?
(b) Find the least squares line, and plot it on the same graph as the data.
(c) Suppose there are birds with eggs even smaller than those of hummingbirds. Would the equation found in part (b) continue to make sense for all positive widths, no matter how small? Explain.
(d) Find the correlation coefficient.
Fantastic news! We've Found the answer you've been seeking!
Step by Step Answer:
Related Book For 

Question Posted:


