All Matches
Solution Library
Expert Answer
Textbooks
Search Textbook questions, tutors and Books
Oops, something went wrong!
Change your search query and then try again
Toggle navigation
FREE Trial
S
Books
FREE
Tutors
Study Help
Expert Questions
Accounting
General Management
Mathematics
Finance
Organizational Behaviour
Law
Physics
Operating System
Management Leadership
Sociology
Programming
Marketing
Database
Computer Network
Economics
Textbooks Solutions
Accounting
Managerial Accounting
Management Leadership
Cost Accounting
Statistics
Business Law
Corporate Finance
Finance
Economics
Auditing
Hire a Tutor
AI Tutor
New
Search
Search
Sign In
Register
study help
mathematics
essential statistics business
Questions and Answers of
Essential Statistics Business
Suggest response check boxes for these questions. In each case, what difficulties do you encounter as you try to think of appropriate check boxes?a. Where are you employed?b. What is the biggest
Give two original examples of(a) Discrete data(b) Continuous data. In each example, explain and identify any ambiguities that might exist. Hint: Consider data describing your own life (e.g., your
Ask each of 20 friends or classmates to choose a whole number between 1 and 5. Tabulate the results. Do the results seem random? If not, can you think of any reasons?
You can test Excel’s algorithm for selecting random integers with a simple experiment. Enter =RANDBETWEEN(1,2) into cell A1 and then copy it to cells A1:E20. This creates a data block of 100 cells
(a) Enter the Excel function =ROUND(NORMINV(RAND(),70,10),0) in cells B1:B100. This will create 100 random data points from a normal distribution using parameters μ = 70 and σ = 10. Think of these
On the web, look up the defects per 100 for all vehicles in the 2018 J.D. Power Initial Quality Ratings.(a) Make a histogram and describe it.(b) Calculate descriptive statistics of center, variation,
In Excel, type a list containing names for 10 of your friends into cells B1:B10. Choose three names at random by randomizing this list. To do this, enter =RAND() into cells A1:A10, copy the random
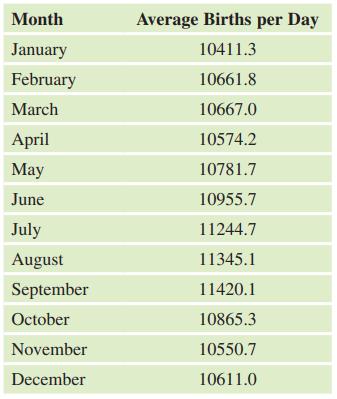
All the births in the United States from 1995 to 2002 were tallied. Then the average number of births per day was calculated and is shown in the table. (Source: ABC News, Tables: Births and Deaths by
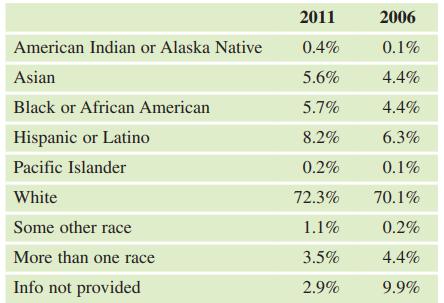
The table shows the ethnic distribution of judges in California in 2006 and 2011, Explain why you should not perform a chisquare test of homogeneity on this data set. 2011 2006 American
A study of colored vegetables and the risk of stroke was done. Although the investigators did not see any effect on stroke of consumption of green, orange, red, yellow, or purple vegetables, they
The magazine Health After 50 reported on the Iowa Women’s Health Study. Experts used a questionnaire to collect data from 39,000 women 55–69 years old concerning their dietary supplements. After
In February 2012, the magazine Health After 50 reported on the Iowa Women’s Health Study. Experts used a questionnaire to collect data from 39,000 women 55–69 years old concerning their dietary
In January 2012, the Harvard Health Letter reported that “moderate consumption of coffee is associated with a lower risk” of stroke. Is this conclusion likely to be the result of an observational
Suppose that a new nicotine patch to help people quit smoking was developed and tested. Smokers voluntarily entered the study and were randomly assigned either the nicotine patch or a placebo patch.
U.S. Unemployment rates for all residents 20 years old and older are given in the data table as a percentage. The table does not include people who are not actively seeking employment. Give two
A Gallup Poll in September 2013 asked people what they considered to be the most important problem in the United States today. The people were also classified by race. If we wanted to test whether
A recent study was conducted to determine whether the drug Nuvigil was effective at helping east-bound jet passengers adjust to jet lag. Subjects were randomly assigned either to one of three
A large number of surgery patients get infections after surgery, which can sometimes be quite serious. Researchers randomly assigned some surgery patients to receive a simple antibiotic ointment
Suppose a polling organization asks a random sample of people if they are Democrat, Republican, or Other and also asks them if they think the country is headed in the right direction or the wrong
There is a theory that relative finger length depends on testosterone level. The table shows a summary of the outcomes of an observational study that one of the authors carried out to determine
Construct heights for 3 or more sets of twins (6 or more people). Make the twins similar, but not exactly the same, in height. Put all of the shorter twins in set A and all of the taller twins in set
Construct two sets of body temperatures (in degrees Fahrenheit, such as 96.2°F), one for men and one for women, such that the sample means are different but the hypothesis test shows the population
Choose a t-test for each situation: one-sample t-test, twosample t-test, paired t-test, and no t-test. a. A random sample of car dealerships is obtained. Then a student walks onto each
For these questions, the data set is given at this text’s website. Assume that the data sets are from random samples and the distributions are Normal. a. Find a 95% confidence interval for the
State whether each situation has independent or paired (dependent) samples. a. A researcher wants to compare the hand–eye coordination of men and women. She finds a random sample of 50 men and
State whether each situation has independent or paired (dependent) samples. a. A researcher wants to know whether pulse rates of people go down after brief meditation. She collects the pulse
A 95% confidence interval for the ages of the first six presidents at their inaugurations is (56.2, 59.5). Either interpret the interval or explain why it should not be interpreted.
Suppose that 200 statistics students each took a random sample (with replacement) of 50 students at their college and recorded the ages of the students in their sample. Then each student used his or
If you take samples of 40 lines from a random number table and find that the confidence interval for the proportion of odd-numbered digits captures 50% 37 times out of the 40 lines, is it the
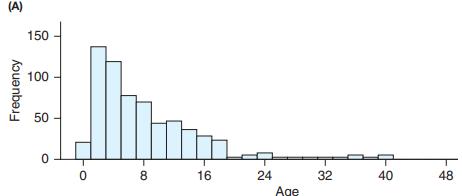
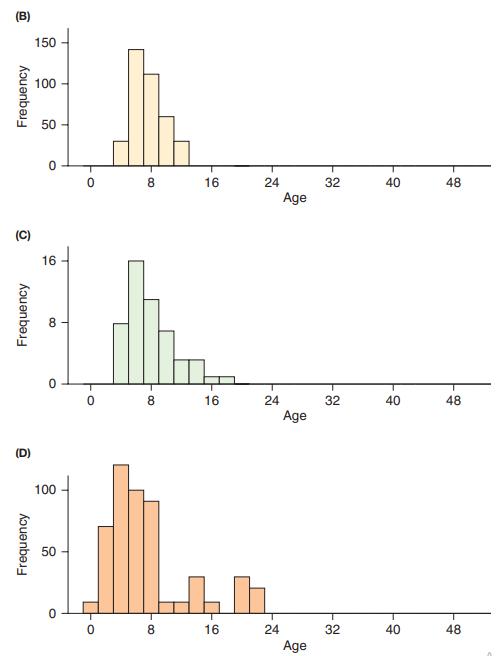
One histogram shows the distribution of ages of all 638 used cars for sale in the Ventura County Star Sunday newspaper in 2013. The other three graphs show distributions of means from random samples
A human resources manager for a large company takes a random sample of 50 employees from the company database. She calculates the mean time that they have been employed. She records this value and
Several times during the year, the U.S. Census Bureau takes random samples from the population. One such survey is the American Community Survey. The most recent such survey, based on a large
A survey of 100 random full-time students at a large university showed the mean number of semester units that students were enrolled in was 15.2 with a standard deviation of 1.5 units. a. Are
A study of all the students at a small college showed a mean age of 20.7 and a standard deviation of 2.5 years. a. Are these numbers statistics or parameters? Explain. b. Label both numbers
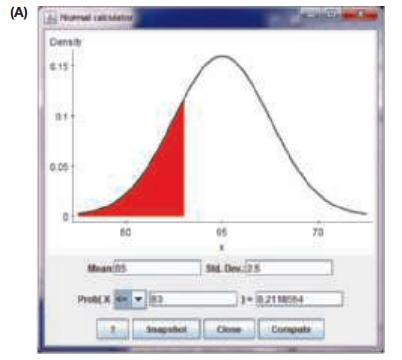
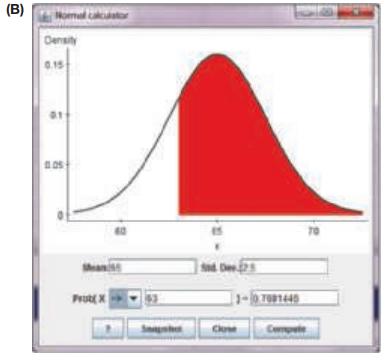
The Normal model N(65, 2.5) describes the distribution of heights of college women (inches). Which of the following questions asks for a probability and which asks for a measurement (and is thus an
A Zener deck of cards has cards that show one of five different shapes with equal representation, so that the probability of selecting any particular shape is 0.20. A card is selected randomly, and a
Assume your class has 30 students and you want a random sample of 10 of them. A student suggests asking each student to flip a coin, and if the coin comes up heads, then he or she is in your sample.
A teacher at a community college sent out questionnaires to evaluate how well the administrators were doing their jobs. All teachers received questionnaires, but only 10% returned them. Most of the
A Zener deck of cards has cards that show one of five different shapes with equal representation, so that the probability of selecting any particular shape is 0.20. A card is selected randomly, and a
A phone survey asked whether Social Security should be continued or abandoned immediately. Only landlines (not cell phones) were called. Do you think this would introduce bias? Explain.
A Zener deck of cards has cards that show one of five different shapes with equal representation, so that the probability of selecting any particular shape is 0.20. A card is selected randomly, and a
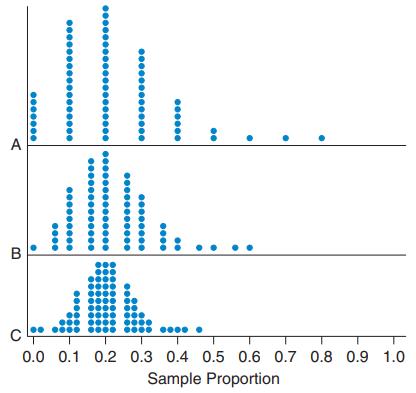
In the graph for Exercise 7.27, explain how you can tell from the shape of the graphs which has the largest sample size and which has the smallest sample size.Data From Exercise 7.27.A Zener deck of
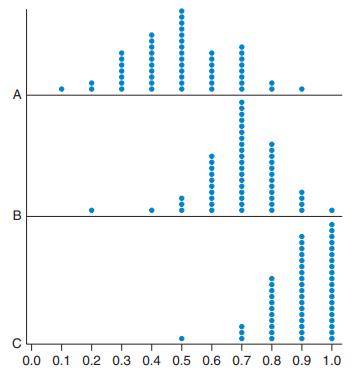
One of the graphs shows the proportion of heads from flipping a fair coin 10 times, repeatedly. The others do not. Which graph represents the coin flips? Explain how you know. А B c4 0.0 0.1
A poll on a proposition showed that we are 95% confident that the population proportion of voters supporting it is between 40% and 48%. Find the sample proportion that supported the proposition.
Which of the graphs in Exercise 7.31 is centered farthest from 0.50? Data From Exercise 7.31.One of the graphs shows the proportion of heads from flipping a fair coin 10 times, repeatedly. The
A poll on a proposition showed that we are 99% confident that the population proportion of voters supporting it is between 52% and 62%. Find the sample proportion that supported the proposition.
Find the sample size required for a margin of error of 3 percentage points, and then find one for a margin of error of 1.5 percentage points; for both, use a 95% confidence level. Find the ratio of
Marco is interested in whether Proposition P will be passed in the next election. He goes to the university library and takes a poll of 100 students. Since 58% favor Proposition P, Marco believes it
Maria opposes capital punishment and wants to find out if a majority of voters in her state support it. She goes to a church picnic and asks everyone there for their opinion. Because most of them
If you walked around your school campus and asked people you met how many keys they were carrying, would you be obtaining a random sample? Explain.
You want to find the mean weight of the students at your college. You calculate the mean weight of a sample of members of the football team. Is this method biased? If so, would the mean of the sample
Suppose that, when taking a random sample of 4 from 123 women, you get a mean height of only 60 inches (5 feet). The procedure may have been biased. What else could have caused this small mean?
Four women selected from a photo of 123 were found to have a sample mean height of 71 inches (5 feet 11 inches). The population mean for all 123 women was 64.6 inches. Is this evidence that the
Choose one of the answers given. The null hypothesis is always a statement about a___________________(sample statistic or population parameter).
Choose one of the answers in each case. In statistical inference, measurements are made on a___________________(sample or population), and generalizations are made to a______________(sample or
Suppose an experiment is done with criminals released from prison in a certain state where the recidivism rate is 40%; that is, 40% of criminals return to prison within three years. One hundred
A research hospital tries a new antibiotic scrub before surgery to see whether it can lower the rate of infections of surgical sites. The old rate of infection is 4%. The null hypothesis is that the
A new drug is being tested to see whether it can reduce the chance of heart attack in people who have previously had a heart attack. The rate of heart attack in the population of concern is 0.20. The
The proportion of people who live after suffering a stroke is 0.85. Suppose there is a new treatment that is used to increase the survival rate. Use the parameter p to represent the population
A teacher is giving an exam with 20 multiple-choice questions, each with four possible answers. The teacher’s null hypothesis is that the student is just guessing, and the population proportion of
A professor creates two versions of a 20-question multiple-choice quiz. Each question has four choices. One student got a score of 19 out of 20 for the version of the test given to the person sitting
A taste test is done to see whether a person can tell Coke from Pepsi. In each case, 20 random and independent trials are done (half with Pepsi and half with Coke) in which the person determines
A researcher carried out a hypothesis test using a two-sided alternative hypothesis. Which of the following z-scores is associated with the smallest p-value? Explain.i. z = 0.50 ii. z =
Sir William Blackstone (1723–1780) wrote influential books on common law. He made this statement: “All presumptive evidence of felony should be admitted cautiously; for the law holds it better
By establishing a small value for the significance level, are we guarding against the first type of error (rejecting the null hypothesis when it is true) or guarding against the second type of error?
Is simple random sampling usually done with or without replacement?
Suppose you want to estimate the mean GPA of all students at your school. You set up a table in the library asking for volunteers to tell you their GPAs. Do you think you would get a representative
You are receiving a large shipment of batteries and want to test their lifetimes. Explain why you would want to test a sample of batteries rather than the entire population.
Suppose you find all the heights of the members of the men’s basketball team at your school. Could you use those data to make inferences about heights of all men at your school? Why or why not?
Suppose you knew the age at inauguration of all the past U.S. presidents. Could you use those data to make inferences about ages of past presidents? Why or why not?
Explain the difference between a sample and a census. Every 10 years, the U.S. Census Bureau takes a census. What does that mean?
A Gallup Poll from December of 2009 estimated that 83% of all people thought nurses had high or very high ethical standards, putting nurses at the top of the professions with regard to this issue. If
Considering all the students at your school, which group is larger: students who play sports OR music, or students who play sports AND music?
Suppose a person is selected at random. Label each pair of events as mutually exclusive or not mutually exclusive. a. The person is a parent; the person is a toddler. b. The person is a
Consider these categories of people, assuming that we are talking about all the people in the United States: Category 1: People who are currently married Category 2: People who have
In the United States, the percentage of adults who own their own home is about 60%. About 90% of U.S. adults own a car. From this information, is it possible to find the percentage of adults who own
Consider a multiple-choice test with a total of four possible options for each question. a. What is the probability of guessing correctly on one question? b. What is the probability that a
a. On a true/false quiz in which you are guessing, what is the probability of guessing correctly on one question? b. What is the probability that a guess on one true/false question will be
A friend flips a coin 10 times and says that the probability of getting a head is 60% because he got six heads. Is the friend referring to an empirical probability or a theoretical probability?
The scatterplot shows the relationship between age and number of text messages sent in a day. Comment on the appropriateness of linear regression.
A teacher wants to find out whether coin flips of pennies have a 50% chance of coming up heads. In the last 5 minutes of class, he has all the students flip pennies until the end of class and then
According to the College Board, the mean quantitative SAT score for male college-bound high school seniors in one year was 530. SAT scores are approximately Normally distributed with a population
Assume a standard Normal distribution. Draw a separate, well-labeled Normal curve for each part. a. Find an approximate z-score that gives a left area of 0.7000. b. Find an approximate
Assume a standard Normal distribution. Draw a separate, well-labeled Normal curve for each part. a. Find the z-score that gives a left area of 0.7123. b. Find the z-score that gives a left
In a standard Normal distribution, if the area to the left of a z-score is about 0.1000, what is the approximate z-score?Assume a standard Normal distribution. Draw a separate, well-labeled Normal
In a standard Normal distribution, if the area to the left of a z-score is about 0.6666, what is the approximate z-score? First locate, inside the table, the number closest to 0.6666. Then find
The Normal model N(500,100) describes the distribution of critical reading SAT scores in the United States. Which of the following questions asks for a probability and which asks for a measurement
In Texas in one year, the average critical reading SAT score was 484. Assume that the standard deviation is 100 and that SAT scores are Normally distributed. Include an appropriately labeled and
In New Jersey in one year, the average critical reading SAT score was 495. Assume that the standard deviation is 100 and that SAT scores are Normally distributed. Include an appropriately labeled and
In Connecticut in one year, the average critical reading SAT score was 509. Assume that the standard deviation is 100 and that SAT scores are Normally distributed. Include an appropriately labeled
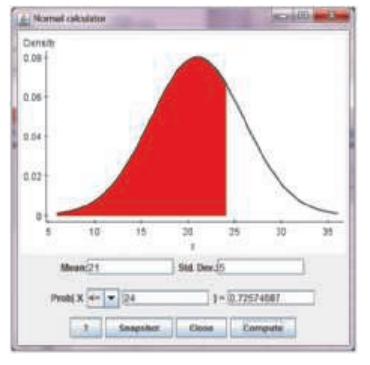
ACT scores are approximately Normally distributed with a mean of 21 and a standard deviation of 5, as shown in the figure. (ACT scores are test scores that some colleges use for determining
Determine whether each of the following variables would best be modeled as continuous or discrete. a. Weight of a person (kilograms) b. Weight of a person (pounds)
Determine whether each of the following variables would best be modeled as continuous or discrete. a. The height of a skyscraper in New York City b. The number of people who have climbed to
College women have a mean height of 65 inches and a standard deviation of 2.5 inches. The distribution of heights for this group is Normal. Choose the correct StatCrunch output for finding the
Determine whether each of the following variables would best be modeled as continuous or discrete. a. The time (seconds) that it takes for light to travel from the sun to Earthb. The number of
a. In your own words, describe to someone who knows only a little statistics how to recognize when an observation is an outlier. What action(s) should be taken with an outlier? b. Which measure
When you are comparing two sets of data, and one set is strongly skewed and the other is symmetric, which measures of the center and variation should you choose for the comparison?
A dieter recorded the number of calories he consumed at lunch for one week. As you can see, a mistake was made on one entry. The calories are listed in increasing order: 331, 374, 387, 392, 405,
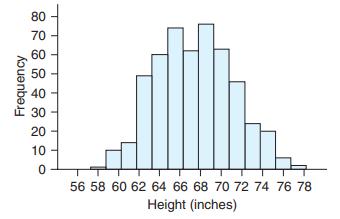
The graph shows the heights for a large group of adults. Describe the distribution, and explain what might cause this shape. 80 70 60 50 - 40 30 20 10 56 58 60 62 64 66 68 70 72 74 76 78 Height
Data were recorded for each of the 50 U.S. states: the state, its population (in 2010), its area (in square miles), and the region in which it is located (Northeast, Midwest, South, or West). For
Showing 1 - 100
of 366
1
2
3
4