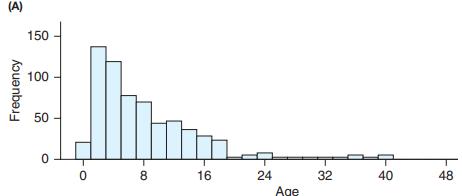
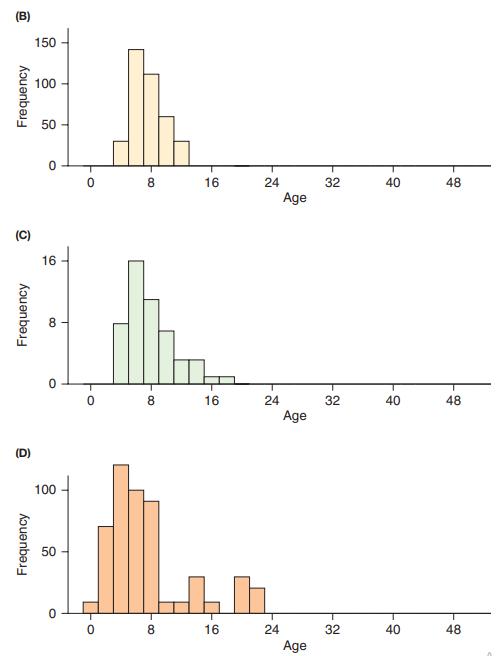
One histogram shows the distribution of ages of all 638 used cars for sale in the Ventura
Question:
One histogram shows the distribution of ages of all 638 used cars for sale in the Ventura County Star Sunday newspaper in 2013. The other three graphs show distributions of means from random samples taken from the same population of used cars. One histogram shows means based on samples of 2 cars, another shows means based on samples of 5 cars, and another shows means based on samples of 10 cars. Each graph based on means was done with many repetitions. Which distribution is which, and why?


Fantastic news! We've Found the answer you've been seeking!
Step by Step Answer:
Related Book For 

Essential Statistics
ISBN: 9780134134406
2nd Edition
Authors: Robert Gould, Colleen N. Ryan, Rebecca Wong
Question Posted:


