One of the graphs shows the proportion of heads from flipping a fair coin 10 times, repeatedly.
Question:
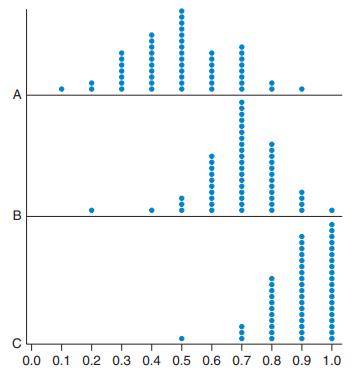
One of the graphs shows the proportion of heads from flipping a fair coin 10 times, repeatedly. The others do not. Which graph represents the coin flips? Explain how you know.
Transcribed Image Text:
А B c4 0.0 0.1 0.2 0.3 0.4 0.5 0.6 0.7 0.8 0.9 1.0
Fantastic news! We've Found the answer you've been seeking!
Step by Step Answer:
Answer rating: 37% (8 reviews)
Graph A is ...View the full answer
Answered By
Romar Bayrante
Hi! I'm Romar Bayrante. I am a Filipino Bachelor IT graduate and have experience assisting different people across the globe. I previously worked as customer/technical support associate in different BPO/Call Center companies. I talked with different people every single day in America as well as Australia through inbound/outbound calls.
I want to explore and use my talent as well as my knowledge on teaching students by answering their queries and helping them for their homework. I want to share also my skills for teaching good conversation.
As an IT graduate, helping students in almost programming subjects are the thing that challenges me. It may take time to consider the best result but teaching students how to make it possible in every single problem they have is a great opportunity for me.
0.00
0 Reviews
10+ Question Solved
Related Book For
Essential Statistics
ISBN: 9780134134406
2nd Edition
Authors: Robert Gould, Colleen N. Ryan, Rebecca Wong
Question Posted:
Students also viewed these Mathematics questions
-
Which of the graphs in Exercise 7.31 is centered farthest from 0.50? Data From Exercise 7.31. One of the graphs shows the proportion of heads from flipping a fair coin 10 times, repeatedly. The...
-
a. From your answers in Exercise 6.8, find the probability of getting 0 heads, 1 head, or 2 heads when flipping a fair coin twice, and report the distribution in a table. b. Make a probability...
-
Match the distribution with one of the graphs in Exercises 912. Justify your decision. Graphs from 9-12: The frequency distribution of scores on a 90-point test where a few students scored much lower...
-
Congratulations! Your portfolio returned 11% last year, 2% better than the market return of 9%. Your portfolio had a standard deviation of earnings equal to 18%, and the risk-free rate is equal to...
-
How many grams of ethylene glycol (C2H6O2) must added to 1.00 kg of water to produce a solution that freezes at - 5.00 oC?
-
You test forms on a schools websites by using some odd information in a given field. Where a ZIP code is supposed be five numerical characters, you used the numerical characters 1234, in addition to...
-
Bowen Corporation has the following shares outstanding: 15,000 shares of \(\$ 50\) par value, six percent preferred stock and 50,000 shares of \(\$ 5\) par value common stock. During its first three...
-
1. What directions of strategic development have been followed by Virgin over the period of the case (use Figure 8.2 as a guide)? 2. Which type of corporate parenting role (as per Figure 8.5) best...
-
As you look at the nine step supply management process, within which steps can things go "wrong", and what types of processes and technology can help ? these are the nine steps 1.Recognition of need....
-
Kiko Teddy Bear is a manufacturer of stuffed teddy bears. Kiko would like to be able to produce 40 teddy bears per hour on its assembly line. Use the information provided in Table to answer the...
-
A poll on a proposition showed that we are 95% confident that the population proportion of voters supporting it is between 40% and 48%. Find the sample proportion that supported the proposition.
-
In the graph for Exercise 7.27, explain how you can tell from the shape of the graphs which has the largest sample size and which has the smallest sample size. Data From Exercise 7.27. A Zener deck...
-
Why could diseconomies of scale never occur if production relationships were only technical relationships?
-
XYZ Limited is having a leather company. It got export awards for 15 years. The company diversified into cotton business. The vagaries of cotton price movement affected the liquidity. What...
-
How can visual aids and graphics enhance the effectiveness of a business report or proposal? Provide guidelines for selecting and integrating charts, graphs, tables, and other visual elements.
-
1. A group of nursing students is discussing how their lives have changed since beginning nursing school. The student who understands the second step of holistic cognitive theory for stress reduction...
-
If the torque required to loosen a nut on the wheel of a car has a magnitude of 40.8 N m. what minimum force must be exerted by a mechanic at the end of a 26.0 cm wrench to loosen the nut? Answer in...
-
Geely Holding Group Acquires Volvo Cars: Chinese Private Enterprises Chase Their Dreams Overseas (text) Question 1. What opportunities and challenges did Geely Holding Group face when it acquired...
-
A manufacturer of table saws has three models, Deluxe, Premium, and Ultimate, which must be painted, assembled, and packaged for shipping. The table gives the number of hours required for each of...
-
Government is advised to tax goods whose demand curves are inelastic if the goal is to raise tax revenues. If the goal is to discourage consumption, then it ought to tax goods whose demand curves are...
-
Which of the following assumptions were used in calculating the P value in the preceding exercise? a. Temperatures for healthy adults are normally distributed. b. These 50 observations are a random...
-
Explain why you either agree or disagree with each of these interpretations of the confidence interval calculated in the preceding exercise. a. 95 percent of healthy adults have temperatures in this...
-
A histogram of ZIP-code income is skewed right. Why do you suppose this is? If ZIP-code income is skewed right, can it also be normally distributed? If ZIP-code income is not normally distributed, is...
-
Here is a small part of the order book for Mesquite Foods: Bid Ask Price Size Price Size $ 103 100 $ 103.50 200 $ 102.50 200 $ 103.80 200 $ 101 400 104 300 $ 99.80 300 $ 104.50 400 a. Georgina...
-
Jobs, Fears, Robots, and Your Future: the driver shortage problem noted points to a larger issue-the mismatch between the jobs available, and the people who are available, willing, and capable of...
-
The University of Cincinnati Center for Business Analytics is an outreach center that collaborates with industry partners on applied research and continuing education in business analytics. One of...
Study smarter with the SolutionInn App