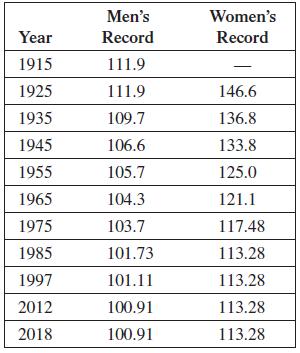
The table shows the mens and womens outdoor world records (in seconds) in the 800-m run. Let
Question:
The table shows the men’s and women’s outdoor world records (in seconds) in the 800-m run.

Let x be the year, with x = 0 corresponding to 1900.
(a) Find the equation for the least squares line for the men’s record (y) in terms of the year (x).
(b) Find the equation for the least squares line for the women’s record.
(c) Suppose the men’s and women’s records continue to improve as predicted by the equations found in parts (a) and (b). In what year will the women’s record catch up with the men’s record? Do you believe that will happen? Why or why not?
(d) Calculate the correlation coefficient for both the men’s and the women’s record. What do these numbers tell you?
(e) Draw a plot of the data, and discuss to what extent a linear function describes the trend in the data.
Step by Step Answer:


