

Question: For games in baseballs National League during nine decades, Table 4.6 shows the percentage of times that the starting pitcher pitched a complete game. a.
For games in baseball€™s National League during nine decades, Table 4.6 shows the percentage of times that the starting pitcher pitched a complete game.
a. Treating the number of games as the same in each decade, the ML fit of the linear probability model is π̂ = 0.7578 €“ 0.0694x, where x = decade (x = 1,2,.. . .9). Interpret 0.7578 and €“ 0.0694.
b. Substituting x = 10, 11, 12, predict the percentages of complete games for the next three decades. Are these predictions plausible? Why?
c. The ML fit with logistic regression is π̂ = exp(l.148 €“ 0.315x)/[1+ exp(l.148 €“ 0.315x)]. Obtain π̂i for x = 10, 11, 12. Are these more plausible?
Table 4.6:
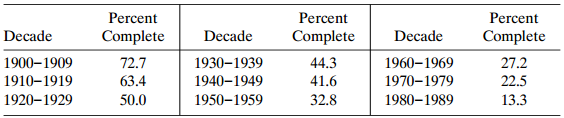
Percent Complete Percent Percent Complete 27.2 22.5 13.3 Decade Decade Decade 19301939 1940-1949 19501959 Complete 44.3 41.6 32.8 19001909 19101919 19201929 72.7 63.4 19601969 1970-1979 19801989 50.0
Step by Step Solution
3.36 Rating (152 Votes )
There are 3 Steps involved in it
a With each decade the estimated probability of a complete ga... View full answer

Get step-by-step solutions from verified subject matter experts