

Question: Refer to Table 2.6. Let D = defendants race, V = victims race, and P = death penalty verdict. Fit the loglinear model (DV, DP,
Refer to Table 2.6. Let D = defendant€™s race, V = victims€™ race, and P = death penalty verdict. Fit the loglinear model (DV, DP, PV).
a. Using the fitted values, estimate and interpret the odds ratio between D and P at each level of V. Note the common odds ratio property.
b. Calculate the marginal odds ratio between D and P, (I) using the fitted values, and (ii) using the sample data. Why are they equal? Contrast the odds ratio with part (a). Explain why Simpson€™s paradox occurs.
c. Fit the corresponding logit model, treating P as the response. Show the correspondence between parameter estimates and fit statistics.
Table 2.6:
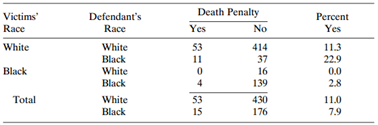
Death Penalty Yes Defendant's Race Percent Victims Yes Yes Race Race No White Black White Black 53 11 414 11.3 22.9 White 37 37 16 139 Black 0.0 2.8 Total 11.0 7.9 53 15 430 176 White Black
Step by Step Solution
3.49 Rating (179 Votes )
There are 3 Steps involved in it
a 042 b 145 ... View full answer

Get step-by-step solutions from verified subject matter experts