

Question: Refer to Table 2.6. Table 5.14 shows the results of fitting a logit model, treating death penalty as the response (1 = yes) and defendants
Refer to Table 2.6. Table 5.14 shows the results of fitting a logit model, treating death penalty as the response (1 = yes) and defendant€™s race (1 = white) and victims€™ race (1 = white) as dummy predictors.
a. Interpret parameter estimates. Which group is most likely to have the yes response? Find the estimated probability in that case.
b. Interpret 95% confidence intervals for conditional odds ratios.
c. Test the effect of defendant€™s race, controlling for victims€™ race, using a (i) Wald test, and (ii) likelihood-ratio test. Interpret.
d. Test the goodness of fit. Interpret.
Table 5.14:
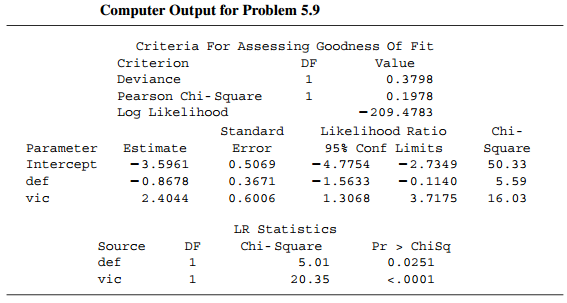
Computer Output for Problem 5.9 Criteria For Assessing Goodness of Fit Criterion Value DF Deviance 0.3798 Pearson Chi- Square Log Likelihood 0.1978 -209.4783 Likelihood Ratio Standard Chi- Estimate 95% Conf Limits Parameter Error Square Intercept -3.5961 0.5069 -4.7754 -2.7349 50.33 def -0.8678 0.3671 -1.5633 -0.1140 5.59 vic 16.03 2.4044 0.6006 1.3068 3.7175 LR Statistics Chi- Square Pr > Chisq Source DF def 5.01 0.0251 vic 20.35
Step by Step Solution
3.29 Rating (167 Votes )
There are 3 Steps involved in it
a Black defendants with white victims had estimated probability e 35961 24044 1 e 35... View full answer

Get step-by-step solutions from verified subject matter experts