

Question: Refer to Table 3.10. In the same survey, gender was cross-classified with party identification. Table 3.11 shows some results. Explain how to interpret all the
Refer to Table 3.10. In the same survey, gender was cross-classified with party identification. Table 3.11 shows some results. Explain how to interpret all the results on this printout.
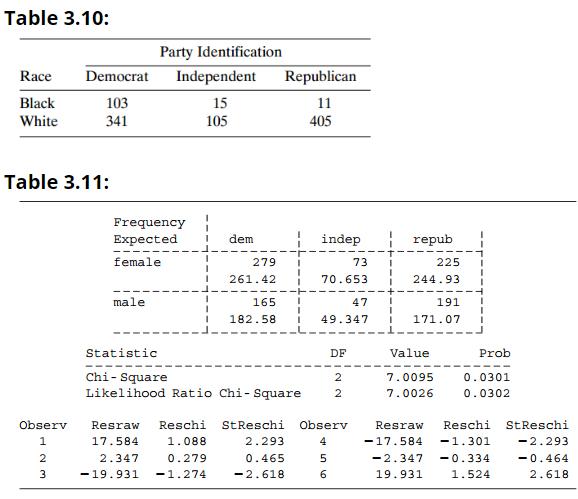
Table 3.10: Party Identification Race Democrat Independent Republican Black 103 341 15 11 White 105 405 Table 3.11: Frequency : Expected dem indep repub female 279 73 225 261.42 70.653 244.93 male 165 47 191 182.58 49.347 171.07 Statistic DF Value Prob Chi- Square Likelihood Ratio Chi- Square 2 7.0095 0.0301 2 7.0026 0.0302 Reschi Observ TESR Observ Resraw StReschi Resraw Reschi StReschi 17.584 1.088 2.293 4 -17.584 -1.301 -2.293 2.347 0.279 0.465 -2.347 -0.334 -0.464 3 -19.931 -1.274 -2.618 6. 19.931 1.524 2.618
Step by Step Solution
3.38 Rating (170 Votes )
There are 3 Steps involved in it
The values X 2 701 and G 2 700 df 2 show considerable ev... View full answer

Get step-by-step solutions from verified subject matter experts