

Question: Refer to Table 8.3. Viewing the table as matched triplets, construct the marginal distribution for each substance. Find the sample proportions of students who used
Refer to Table 8.3. Viewing the table as matched triplets, construct the marginal distribution for each substance. Find the sample proportions of students who used marijuana, alcohol, and cigarettes. Test the hypothesis of marginal homogeneity. Interpret results.
Table 8.3:
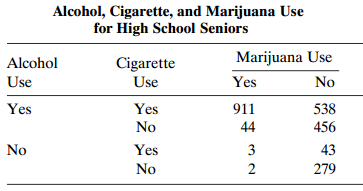
Alcohol, Cigarette, and Marijuana Use for High School Seniors Marijuana Use Alcohol Cigarette Use Use Yes No Yes Yes 911 538 No 44 456 No Yes 3 43 No 2 279
Step by Step Solution
3.43 Rating (159 Votes )
There are 3 Steps involved in it
The sample proportions of yes responses are 86 for ... View full answer

Get step-by-step solutions from verified subject matter experts