

Question: Table 2.10 refers to applicants to graduate school at the University of California at Berkeley, for fall 1973. It presents admissions decisions by gender of
Table 2.10 refers to applicants to graduate school at the University of California at Berkeley, for fall 1973. It presents admissions decisions by gender of applicant for the six largest graduate departments. Denote the three variables by A = whether admitted, G = gender, and D = department. Find the sample AG conditional odds ratios and the marginal odds ratio. Interpret, and explain why they give such different indications of the AG association.
Table 2.10:
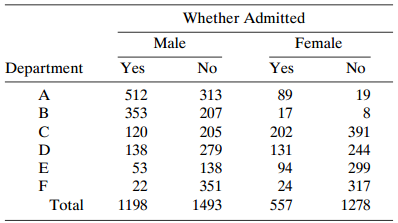
Whether Admitted Male Female Yes Department Yes No No 512 313 207 89 19 A B 353 17 120 205 202 391 D 138 279 131 244 299 53 138 94 22 351 24 317 1278 Total 1198 1493 557
Step by Step Solution
3.48 Rating (164 Votes )
There are 3 Steps involved in it
Marginal odds ratio 184 but most conditional odds ratios are close to 10 except in Department ... View full answer

Get step-by-step solutions from verified subject matter experts