

Question: Table 3.13 shows the results of a retrospective study comparing radiation therapy with surgery in treating cancer of the larynx. The response indicates whether the
Table 3.13 shows the results of a retrospective study comparing radiation therapy with surgery in treating cancer of the larynx. The response indicates whether the cancer was controlled for at least two years following treatment. Table 3.14 shows SAS output.
a. Report and interpret the P-value for Fisher€™s exact test with (i) Hα: θ > 1, and (ii) Hα: 0 ‰ 1. Explain how the P-values are calculated.
b. Interpret the confidence intervals for θ. Explain the difference between them and how they were calculated.
c. Find and interpret the one-sided mid-P-value. Give advantages and disadvantages of this type of P-value.
Table 3.13:
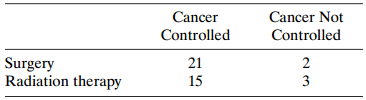
Table 3.14:
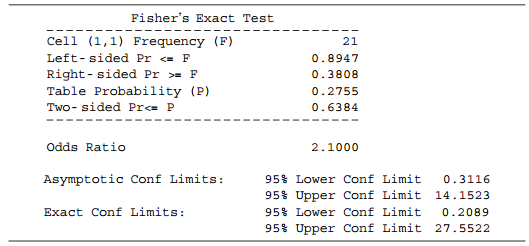
Cancer Controlled Cancer Not Controlled 21 15 Surgery Radiation therapy 3 Fisher's Exact Test Cell (1,1) Frequency (F) 21 Left- sided Pr = F Table Probability (P) Two- sided Pr
Step by Step Solution
3.47 Rating (176 Votes )
There are 3 Steps involved in it
a It is plausible that control of cancer Is independent of tr... View full answer

Get step-by-step solutions from verified subject matter experts