Table 6.17 is taken from the 1989 General Social Survey. Subjects were asked their opinions regarding government
Question:
Table 6.17 is taken from the 1989 General Social Survey. Subjects were asked their opinions regarding government spending on the environment (E), health (H), assistance to big cities (C), and law enforcement (L). The common re- sponse scale was (too little, about right, too much). (Note that, despite the common public complaint about taxes, the highest counts occur in cells corre- sponding to preferring increased spending on most items!)
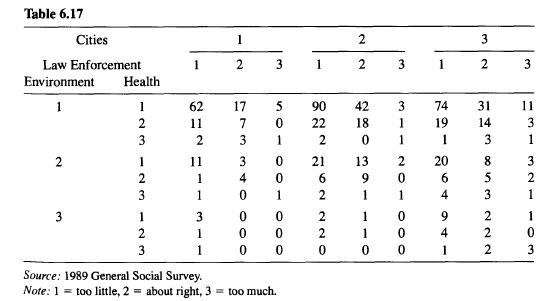
a. Fit the homogeneous association model. Test the fit, and interpret.
b. Show that the estimated conditional log odds ratio for the "too much" and "too little" categories of E and H equals
![]()
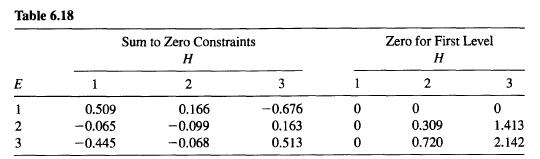
Table 6.18 reports (EH) using constraints whereby parameters sum to zero within each row and within each column, and whereby parameters are zero in the first row and the first column. Calculate and interpret the odds ratio. Show how to obtain the same result using the corner fitted values for a partial table relating E and H at any combination of levels of the other two variables. The ASE of the estimated E-H log odds ratio is 0.523. Show that a 95% confidence interval for the true odds ratio equals (3.1, 24.4). Interpret.
c. Report the estimated conditional odds ratios using the "too much" and "too little" categories for each of the other pairs of variables. Summarize the association structure for this table.
Step by Step Answer: