

Question: On a Robeson (1991) plot (a log-log plot of selectivity versus oxygen permeability in Barrer), the upper bound for separation of oxygen from nitrogen plots
On a Robeson (1991) plot (a log-log plot of selectivity versus oxygen permeability in Barrer), the upper bound for separation of oxygen from nitrogen plots as a straight line. Approximate values of end points are \(\mathrm{P}_{\mathrm{O} 2}=0.0001\) Barrer, \(\alpha_{\mathrm{O} 2-\mathrm{N} 2}=42.0 ;\) and \(\mathrm{P}_{\mathrm{O} 2}=10,000\) Barrer, \(\alpha_{\mathrm{O} 2-\mathrm{N} 2}=1.9\). Barrer \(=10^{-10}[\mathrm{cc} \mathrm{STP} \mathrm{cm}] /\left[\mathrm{cm}^{2}\right.\) \(\mathrm{s} \mathrm{cm} \mathrm{Hg}]\).
a. Find the equation for the straight line.
b. In the Robeson (2008) paper, the upper bound for \(\mathrm{O}_{2}-\mathrm{N}_{2}\) was higher, although the slope was essentially unchanged. Based on the PIM-1 and PIM-7 data in Table 19-2, estimate the equation for the new straight line.
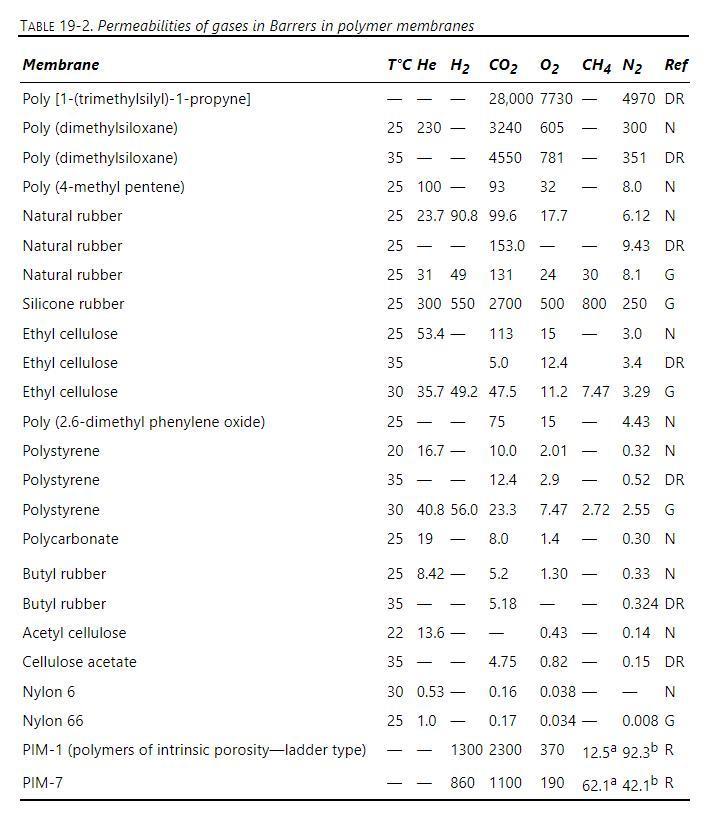
TABLE 19-2. Permeabilities of gases in Barrers in polymer membranes TC He H2 CO2 O2 CH4 N2 Ref Membrane Poly [1-(trimethylsilyl)-1-propyne] Poly (dimethylsiloxane) Poly (dimethylsiloxane) Poly (4-methyl pentene) Natural rubber Natural rubber 25 100 Natural rubber Silicone rubber Ethyl cellulose Ethyl cellulose Ethyl cellulose Poly (2.6-dimethyl phenylene oxide) Polystyrene Polystyrene Polystyrene Polycarbonate Butyl rubber Butyl rubber Acetyl cellulose Cellulose acetate Nylon 6 Nylon 66 PIM-1 (polymers of intrinsic porosity-ladder type) PIM-7 28,000 7730 - 4970 DR 25 230 - 3240 605 300 N 35 - - 4550 781 351 DR 93 32 - 8.0 N 25 23.7 90.8 99.6 17.7 6.12 N 25 - - 153.0 9.43 DR 25 31 49 131 24 30 8.1 G 25 300 550 2700 25 53.4- 113 35 500 800 250 G 15 - 3.0 N 5.0 12.4 3.4 DR 30 35.7 49.2 47.5 11.2 7.47 3.29 G 25 - - 75 15 4.43 N 20 16.7 - 10.0 2.01 - 0.32 N 35 - - 12.4 2.9 - 0.52 DR 30 40.8 56.0 23.3 7.47 2.72 2.55 G 25 19 - 8.0 1.4 - 0.30 N 25 8.42 5.2 1.30 0.33 N 35 - 5.18 - 0.324 DR 22 13.6- - 0.43 0.14 N 35 - - 4.75 0.82 0.15 DR 30 0.53- 0.16 0.038- N 25 1.0 - 0.17 0.034 0.008 G 1300 2300 370 12.5a 92.3b R ] 860 1100 190 62.1a 42.1b R
Step by Step Solution
3.45 Rating (158 Votes )
There are 3 Steps involved in it

Get step-by-step solutions from verified subject matter experts