

Question: Viscosity data for air as a function of temperature are shown in Table 1.1. Fit a power-law model of the type [mu=A T^{n}] to represent
Viscosity data for air as a function of temperature are shown in Table 1.1. Fit a power-law model of the type
\[\mu=A T^{n}\]
to represent the data. Note that the viscosity of gases increases with increasing temperature, whereas that of liquids decreases.
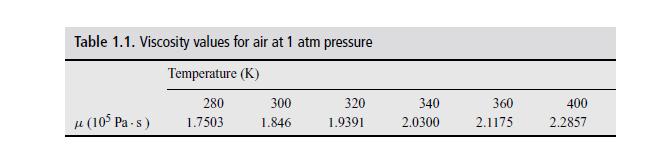
Table 1.1. Viscosity values for air at 1 atm pressure Temperature (K) 280 (10 Pa-s) 1.7503 340 360 2.1175 400 2.2857 300 320 1.846. 1.9391 2.0300
Step by Step Solution
★★★★★
3.42 Rating (152 Votes )
There are 3 Steps involved in it
1 Expert Approved Answer
Step: 1 Unlock

Question Has Been Solved by an Expert!
Get step-by-step solutions from verified subject matter experts
Step: 2 Unlock
Step: 3 Unlock