

Question: For the penicillin reactor in Example 22.2, using repeated simulations, search for the optimal feed profile to maximize: [0.025 P{tau} V{tau}-1.68 tau-0.00085 int_{0}^{tau} F{t} d
For the penicillin reactor in Example 22.2, using repeated simulations, search for the optimal feed profile to maximize:
\[0.025 P\{\tau\} V\{\tau\}-1.68 \tau-0.00085 \int_{0}^{\tau} F\{t\} d t\]
where \(\tau\) is the batch time. This objective function maximizes the penicillin produced while penalizing long batch times and the cost of the substrate feed stream. Indicate how the penalty terms affect the feed rate profile.
Data From Example 22.2:-
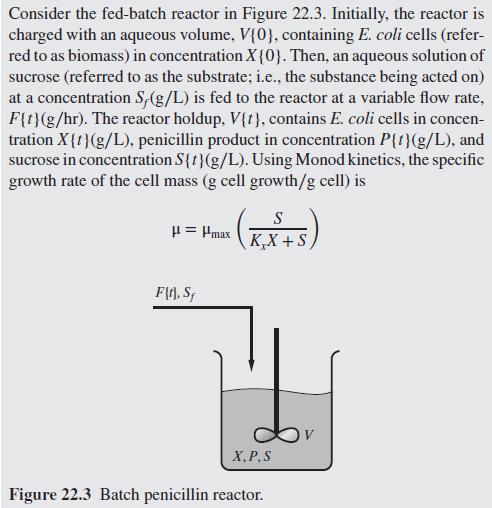

Consider the fed-batch reactor in Figure 22.3. Initially, the reactor is charged with an aqueous volume, V{0}, containing E. coli cells (refer- red to as biomass) in concentration X{0}. Then, an aqueous solution of sucrose (referred to as the substrate; i.e., the substance being acted on) at a concentration S,(g/L) is fed to the reactor at a variable flow rate, F{1}(g/hr). The reactor holdup, V{f}, contains E. coli cells in concen- tration X{1}(g/L), penicillin product in concentration P{1}(g/L), and sucrose in concentration S{1}(g/L). Using Monod kinetics, the specific growth rate of the cell mass (g cell growth/g cell) is S | = |max KX+S F\\. S X,P,S Figure 22.3 Batch penicillin reactor.
Step by Step Solution
3.35 Rating (161 Votes )
There are 3 Steps involved in it

Get step-by-step solutions from verified subject matter experts