

Question: In Example 22.4, derive Eqs. (22.6) and (22.7). Then, graph the economic potential as a function of the reactor batch time for various values of
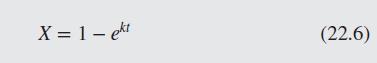
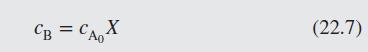
In Example 22.4, derive Eqs. (22.6) and (22.7). Then, graph the economic potential as a function of the reactor batch time for various values of the rate constant, \(k\), over the range \(0.4-0.6\) day \(^{-1}\).
Data From Example 22.4:-
Equation 22.6 and 22.7:-
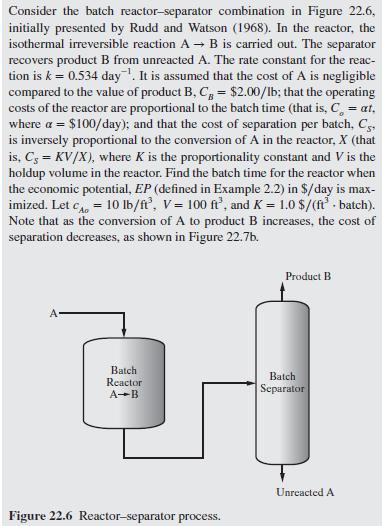
Consider the batch reactor-separator combination in Figure 22.6. initially presented by Rudd and Watson (1968). In the reactor, the isothermal irreversible reaction A B is carried out. The separator recovers product B from unreacted A. The rate constant for the reac- tion is k = 0.534 day. It is assumed that the cost of A is negligible compared to the value of product B, C, = $2.00/lb; that the operating costs of the reactor are proportional to the batch time (that is, C = at, where a = $100/day); and that the cost of separation per batch, Cs, is inversely proportional to the conversion of A in the reactor, X (that is, C = KV/X), where K is the proportionality constant and V is the holdup volume in the reactor. Find the batch time for the reactor when the economic potential, EP (defined in Example 2.2) in $/day is max- imized. Let c = 10 lb/ft, V = 100 ft, and K = 1.0$/(ft batch). Note that as the conversion of A to product B increases, the cost of separation decreases, as shown in Figure 22.7b. Product B Batch Reactor A-B Batch Separator Figure 22.6 Reactor-separator process. Unreacted A
Step by Step Solution
3.39 Rating (155 Votes )
There are 3 Steps involved in it

Get step-by-step solutions from verified subject matter experts