The following table shows mobile device usage by Black Friday shoppers from 2010 to 2015. The middle
Question:
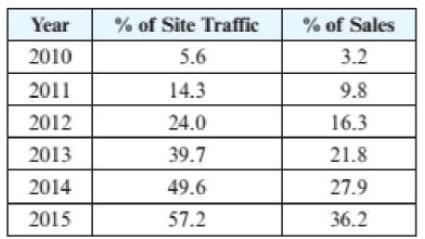
The following table shows mobile device usage by Black Friday shoppers from 2010 to 2015. The middle column lists the percentages of online site traffic due to mobile devices (rather than PCs), and the third column lists the percentages of online sales.
Let x be the percentage of site traffic and y the percentage of sales. Use linear regression to find h(x) = ax + b that models the second and third columns. Predict the percentage of sales if the site traffic were to reach 70%.
Fantastic news! We've Found the answer you've been seeking!
Step by Step Answer:
Related Book For 

College Algebra With Modeling And Visualization
ISBN: 9780134418049
6th Edition
Authors: Gary Rockswold
Question Posted:


