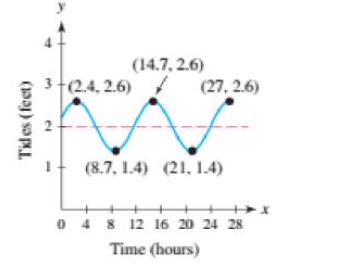
The graph gives the tides at Clearwater Beach, Florida, x hours after midnight on a particular day,
Question:
The graph gives the tides at Clearwater Beach, Florida, x hours after midnight on a particular day, where 0 ≤ x ≤ 27.
When were water levels increasing?
Transcribed Image Text:
Tides (feet) (14.7, 2.6) 7 (27,2.6) A f 3-(2.4.2.6) (8.7, 1.4) (21, 1.4) 0 4 8 12 16 20 24 28 Time (hours)
Fantastic news! We've Found the answer you've been seeking!
Step by Step Answer:
Answer rating: 36% (11 reviews)
According to the gr...View the full answer

Answered By

Sigei Kipngeno
I am a professional writer with more than 2 years of writing experience. I will always deliver a grade A paper with zero plagiarism . Thanks in advance.
4.70+
175+ Reviews
311+ Question Solved
Related Book For 

College Algebra With Modeling And Visualization
ISBN: 9780134418049
6th Edition
Authors: Gary Rockswold
Question Posted:
Students also viewed these Mathematics questions
-
The graph gives the tides at Clearwater Beach, Florida, x hours after midnight on a particular day, where 0 x 27. When were water levels decreasing? Tides (feet) (14.7, 2.6) 7 (27,2.6) A f...
-
Planning is one of the most important management functions in any business. A front office managers first step in planning should involve determine the departments goals. Planning also includes...
-
Managing Scope Changes Case Study Scope changes on a project can occur regardless of how well the project is planned or executed. Scope changes can be the result of something that was omitted during...
-
The following is a sufficient condition, the Laplace-Liapounoff condition, for the central limit theorem: If X 1 , X 2 , X 3 , . . . is a sequence of independent random variables, each having an...
-
Why are the seasons on Uranus different from the seasons on any other planet?
-
please answer all 4 multiple choice questions (chegg policy allows 4 mc questions) Dual class. Which one of the following types of stock has a residual claim, not preferential treatment in respect to...
-
4. Average exchange rates are used to translate certain items from foreign income statements into U.S. dollars. Such averages are used to: a Approximate the effects of using the current exchange...
-
In 1997, Bobby Randall was hired at Wal-Mart. At the time, Randall was not a convicted felon but had been previously convicted three times on misdemeanor charges for indecent exposure. At the time of...
-
Hart Company sells and delivers office furniture across Western Canada The costs associated with the acquisition and annual operation of a delivery truck are given below Insurance Licences Taxes...
-
Graph y = f(x) in the viewing rectangle [-4.7,4.7, 1] by [-3.1, 3.1, 1]. (a) Use the graph to evaluate f(2). (b) Evaluate f(2) symbolically. (c) Let x = -3, -2, -1, 0, 1, 2, 3 and make a table of...
-
Identify where f is increasing and where f is decreasing. Consider the graph y = f(x). f(x) = -x
-
What are the most common project management risks?
-
Encouraging you to sit back and watch a full hour of one of your favorite shows on prime-time television. However, instead of getting up during the commercial break or fast forwarding through the...
-
A family member has been recently diagnosed with a heart condition that requires replacing a heart valve. She points out that if she goes to India, the surgery cost is about 60% cheaper on average...
-
Based on the case of Bowers Machine Parts. Critically analyze why people were not doing their best and critically explain why hiring a consultant might solve the issue. Justify your answer by using...
-
Identify a few strategies for sustainability effectiveness. Should sustainability be a corporation's top priority? Why or why not? What are the challenges associated with implementing sustainable...
-
Answer the following questions for the topic you want to write about. Type your answers in a separate Word document. What is the issue or debatable idea you might write about? What is debatable about...
-
George Tanner died October 2, 2016, survived by his son Thomas and his daughter Gigi Tanner Stewart and her children, Sam and Cindy. George was the sole stockholder of Tanner, Inc., a C corporation....
-
Suppose the concentration of glucose inside a cell is 0.1 mm and the cell is suspended in a glucose solution of 0.01 mm. a. What would be the free energy change involved in transporting 10-o mole of...
-
In Exercises 1138, use the given conditions to write an equation for each line in point-slope form and slope-intercept form. Slope = 4, passing through (1, 3)
-
In Exercises 116, use the graph of y = f(x) to graph each function g. g(x) = 2f(x) y y = f(x) 4- (-2,2) 1- -5-4-3-2. [T (0,2) (2.2) H 1 2 3 4 5 [IIIDIICO X
-
In Exercises 130, find the domain of each function. g(x) 1 x + 4 1 x - 4 X
-
QUESTION 3 A business owns seven flats rented out to staff at R500 per month. All flats were tenanted Ist january 21 months rent was in arrears and as at 31st December 14 months' rent wa Identify the...
-
1. 2. 3. Select the Tables sheet, select cells A6:B10, and create range names using the Create from Selection button [Formulas tab, Defined Names group]. Select cells B1:F2 and click the Name box....
-
Tropical Rainwear issues 3,000 shares of its $18 par value preferred stock for cash at $20 per share. Record the issuance of the preferred shares. (If no entry is required for a particular...

Study smarter with the SolutionInn App


