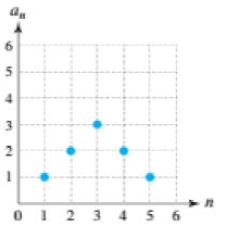
Use the graphical representation to identify the terms of the finite sequence. 6 5 M 0 1
Question:
Use the graphical representation to identify the terms of the finite sequence.
Transcribed Image Text:
6 5 M 0 1 2 3 4 5 6
Fantastic news! We've Found the answer you've been seeking!
Step by Step Answer:
Answer rating: 92% (14 reviews)
The points 1 1 2 2 3 ...View the full answer

Answered By

Branice Buyengo Ajevi
I have been teaching for the last 5 years which has strengthened my interaction with students of different level.
4.30+
1+ Reviews
10+ Question Solved
Related Book For 

College Algebra With Modeling And Visualization
ISBN: 9780134418049
6th Edition
Authors: Gary Rockswold
Question Posted:
Students also viewed these Mathematics questions
-
The convolution sum of a finite sequence x[n] with the impulse response h[n] of an FIR system can be written in a matrix form y = Hx where H is a matrix, x and y are input and output values. Let h[n]...
-
Case Study: Quick Fix Dental Practice Technology requirements Application must be built using Visual Studio 2019 or Visual Studio 2017, professional or enterprise. The community edition is not...
-
The controller is satisfied with the graphical representation you prepared in conjunction with 15-40. She thinks this graphical representation of variable overhead variances will be well received by...
-
Calculate the heat released as 35.5 g of copper (0.0920 cal/g x C) cools from 50.0 C to 25.0 C.
-
Conway County National Bank presents us with these figures for the year just concluded. Please determine the net profit margin, equity multiplier, asset utilization ratio, and ROE. Net...
-
What are general controls? Do the general controls directly affect computer applications? How does the auditor determine whether general control procedures should be tested?
-
Figure Q25.3 shows the bands of color that are produced when a thin soap-bubble film is exposed to white light. What mechanism produces the colors seen here? Is the bubble of uniform thickness? If...
-
An investor considers investing $10,000 in the stock market. He believes that the probability is 0.30 that the economy will improve, 0.40 that it will stay the same, and 0.30 that it will...
-
Stocks A and B have the following probability distributions of expected future returns: Probability A B 0 . 1 ( 6 % ) ( 3 9 % ) 0 . 2 6 0 0 . 4 1 2 2 2 0 . 2 2 0 2 8 0 . 1 3 2 3 5 Calculate the...
-
Sketch a graph of a hyperbola, centered at the origin, with the foci, vertices, and asymptotes shown in the figure. Find an equation of the hyperbola. (The coordinates of the foci and vertices are...
-
Use mathematical induction to prove the statement. Assume that n is a positive integer. 1 +2+ 3 + + n n(n + 1)(2n + 1) 6
-
On 1 February 2022, T Abella commenced business with $50 000 bank and a loan from Strate bank $20 000. On 3 February T Abella purchased the existing continuing business of T Longman for $48 000 and...
-
Question: Divide.21r7-35r37r3r8-5r43r7-5r33r6-5r221r6-35r2 Divide. 2 1 r7 - 3 5 r3 7r 3r 8 - 5 r4 3 r7 - 5 r3 3 r6 - 5 r2 2 1 r6 - 3 5 r2 Divide. 21r7 - 35r 7r 38-54 3r7-53 3r6-52 216-3512
-
System of Equations: Value of a Value of b 9 a + 3 b = 3 0 8 a + 4 b = 2 8
-
An important practice is to check the validity of any data set that you analyze. One goal is to detect typos in the data, and another would be to detect faulty measurements. Recall that outliers are...
-
ve The re e Problem 3 Complete the following perpetual inventory form. Perpetual Inventory Total Product Name: Purchase Unit Size: Carried Forward: Date In Out 1/7 3 Balance 1/9 1/10 1/12 1/15 2 1 5...
-
the above date, Saloni was admitted in the partnership firm. Raman surrendered th 5 2 of his share and Rohit surrendered th 5 1 of his share in favour of Saloni. It was agreed that : (i) Plant and...
-
The following pictograph shows the number of new homes constructed from July 2012 to July 2013, by region. Use this graph to below answer Exercises. 1. Which region had the fewest new homes...
-
Copy and complete the statement. 3800 m ? km =
-
What type of distribution is most commonly applied to behavioral research?
-
A normal distribution has a mean of 0 and a standard deviation of -1.0. Is this possible? Explain.
-
A normal distribution has a standard deviation equal to 10. What is the mean of this normal distribution if the probability of scoring below x = 10 is .5000?
-
3 . Accounting.. How does depreciation impact financial statements, and what are the different methods of depreciation?
-
NEED THIS EXCEL TABLE ASAP PLEASE!!!! Presupuesto Operacional y C lculo del COGS Ventas Proyectadas: Ventas Proyectadas: $ 4 5 0 , 0 0 0 Precio por unidad: $ 4 5 0 Unidades vendidas: 4 5 0 , 0 0 0 4...
-
The wash sale rules apply to disallow a loss on a sale of securities_______? Only when the taxpayer acquires substantially identical securities within 30 days before the sale Only when the taxpayer...

Study smarter with the SolutionInn App


