

Question: An object has the acceleration graph shown in Figure P2.23. Its velocity at t = 0 s is v x = 2.0 m/s. Draw the
An object has the acceleration graph shown in Figure P2.23. Its velocity at t = 0 s is vx = 2.0 m/s. Draw the object’s velocity graph.
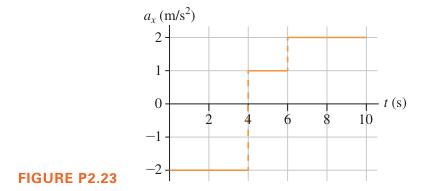
FIGURE P2.23 a, (m/s) 2+ 1 0 2 4 6 8 10 1(s)
Step by Step Solution
★★★★★
3.40 Rating (159 Votes )
There are 3 Steps involved in it
1 Expert Approved Answer
Step: 1 Unlock

AbsolutelyI can analyze the acceleration graph Figure P223 and determine the objects velocity graph Understanding the Relationship The relationship be... View full answer
Question Has Been Solved by an Expert!
Get step-by-step solutions from verified subject matter experts
Step: 2 Unlock
Step: 3 Unlock