

21. Figure 27.16 shows data of stopping potential versus frequency for a certain material. Use...
Question:
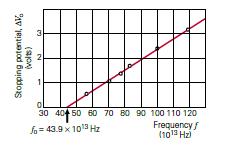
21. •• ▼ Figure 27.16 shows data of stopping potential versus frequency for a certain material. Use the graph to determine
(a) Planck’s constant and
(b) the work function of that material.
Step by Step Answer:

This question has not been answered yet.
You can Ask your question!
Related Book For 
College Physics Essentials Electricity And Magnetism Optics Modern Physics Volume Two
ISBN: 9781032337272
8th Edition
Authors: Jerry D. Wilson, Anthony J. Buffa, Bo Lou
Question Posted:
