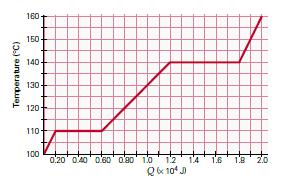
41. As heat is added to one kilogram of a substance, the data results in the...
Question:
41. ••• As heat is added to one kilogram of a substance, the data results in the T-versus-Q graph of ▼ Figure 11.17.
(a) What are its melting and boiling points? In SI units, what are
(b) the specific heats of it during the various phases and
(c) the heats of transformation of it as the phase changes?

Step by Step Answer:
Related Book For 

College Physics Essentials Electricity And Magnetism Optics Modern Physics Volume Two
ISBN: 9781032337272
8th Edition
Authors: Jerry D. Wilson, Anthony J. Buffa, Bo Lou
Question Posted:


