

Question: Figure P29.8 is an energylevel diagram for a simple atom. What wavelengths appear in the atom's (a) emission spectrum and (b) absorption spectrum? An electron
Figure P29.8 is an energylevel diagram for a simple atom. What wavelengths appear in the atom's
(a) emission spectrum and
(b) absorption spectrum?
An electron with \(2.0 \mathrm{eV}\) of \(n=3 \longrightarrow E_{3}=4.0 \mathrm{eV}\)
\(n=2 \longrightarrow E_{2}=1.5 \mathrm{eV}\)
\(n=1 \longrightarrow E_{1}=0.0 \mathrm{eV}\)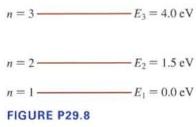
-3- E-4.0 eV 11-2 E-1.5 eV -1- E-0.0 eV FIGURE P29.8
Step by Step Solution
3.43 Rating (153 Votes )
There are 3 Steps involved in it
To determine the wavelengths that appear in the atoms emission and absorption spectra we need to con... View full answer

Get step-by-step solutions from verified subject matter experts