Which of the curves in Figure P22.72 best represents the expected variation in current as a function
Question:
Which of the curves in Figure P22.72 best represents the expected variation in current as a function of time in the short time interval immediately after the bulb is turned on?
You've probably observed that the most common time for an incandescent lightbulb to fail is the moment when it is turned on. Let's look at the properties of the bulb's filament to see why this happens.
The current in the tungsten filament of a lightbulb heats the filament until it glows. The filament is so hot that some of the atoms on its surface fly off and end up sticking on a cooler part of the bulb. Thus the filament gets progressively thinner as the bulb ages. There will certainly be one spot on the filament that is a bit thinner than elsewhere. This thin segment will have a higher resistance than the surrounding filament. More power will be dissipated at this spot, so it won't only be a thin spot, it also will be a hot spot.
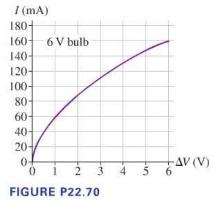
Now, let's look at the resistance of the filament. The graph in Figure P22.70 shows data for the current in a lightbulb as a function of the potential difference across it. The graph is not linear, so the filament is not an ohmic material with a constant resistance. However, we can define the resistance at any particular potential difference \(\Delta V\) to be \(R=\Delta V I I\). This ratio, and hence the resistance, increases with \(\Delta V\) and thus with temperature.
Step by Step Answer:

College Physics A Strategic Approach
ISBN: 9780321907240
3rd Edition
Authors: Randall D. Knight, Brian Jones, Stuart Field


