

Create a pie chart to visualize these data. The purchasing department for a chain of bookstores wants
Question:
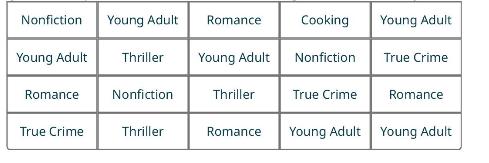
Create a pie chart to visualize these data.
The purchasing department for a chain of bookstores wants to make sure they're buying the right types of books to put on the shelves, so they take a sample of 20 books that customers bought in the last five days and record the genres:
Fantastic news! We've Found the answer you've been seeking!
Step by Step Answer:

Answered By
Anoop V
I have five years of experience in teaching and I have National Eligibility in teaching (UGC-NET) .
1+ Reviews
10+ Question Solved
Related Book For 

Question Posted:
