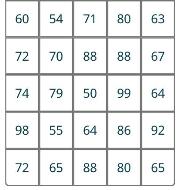
Make a histogram to visualize these results. Use bins of width 10. An elementary school class is
Question:
Make a histogram to visualize these results. Use bins of width 10.
An elementary school class is administered a standardized test for which scores range from 0 to 100 , as shown below:

Fantastic news! We've Found the answer you've been seeking!
Step by Step Answer:
Related Book For 

Question Posted:


