

Table 11.9 contains a list of the five U.S. states ranked sixth through tenth in the number
Question:
Table 11.9 contains a list of the five U.S. states ranked sixth through tenth in the number of representatives in the U.S. House of Representatives, along with the population of that state in 2021. Use the information in the table to answer the questions.

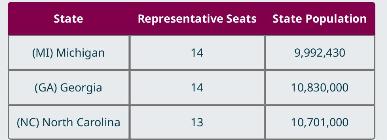
1. What is the ratio of State Population to Representative Seats for each state to the nearest hundred thousand?
2. What is the ratio of Representative Seats to State Population for each state rounded to seven decimal places?
3. What is the ratio of Representative Seats to State Population for each state rounded to six decimal places?
4. Does there appear to be a constant ratio? Are the results similar to the top five states?
Fantastic news! We've Found the answer you've been seeking!
Step by Step Answer:

Answered By
Nazrin Ziad
I am a post graduate in Zoology with specialization in Entomology.I also have a Bachelor degree in Education.I posess more than 10 years of teaching as well as tutoring experience.I have done a project on histopathological analysis on alcohol treated liver of Albino Mice.
I can deal with every field under Biology from basic to advanced level.I can also guide you for your project works related to biological subjects other than tutoring.You can also seek my help for cracking competitive exams with biology as one of the subjects.
2+ Reviews
10+ Question Solved
Related Book For 

Question Posted:
