

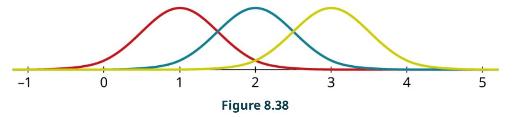
This graph shows three normal distributions. What are their means? -1 1 2 Figure 8.38 3 4
Question:
This graph shows three normal distributions. What are their means?
Step by Step Answer:

This question has not been answered yet.
You can Ask your question!
Related Book For 

Question Posted:
