

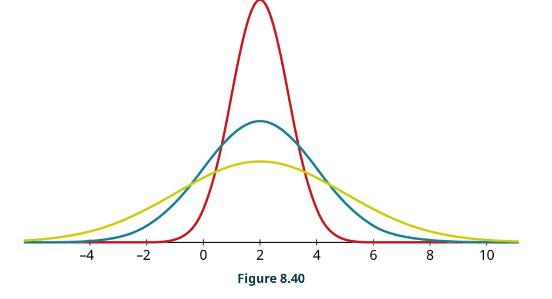
This graph shows three distributions, all with mean 2 . What are their standard deviations? Figure 8.40
Question:
This graph shows three distributions, all with mean 2 . What are their standard deviations?
Step by Step Answer:

This question has not been answered yet.
You can Ask your question!
Related Book For 

Question Posted:
