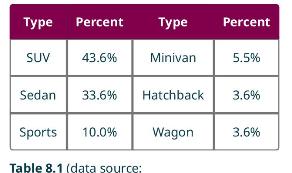
Use the data that follows to generate a pie chart. Type Percent Type Percent SUV 43.6% Minivan
Question:
Use the data that follows to generate a pie chart.

Transcribed Image Text:
Type Percent Type Percent SUV 43.6% Minivan 5.5% Sedan 33.6% Hatchback 3.6% Sports 10.0% Wagon 3.6% Table 8.1 (data source:
Fantastic news! We've Found the answer you've been seeking!
Step by Step Answer:
Answer rating: 100% (QA)

Answered By

Ehsan Mahmood
I’ve earned Masters Degree in Business Studies and specialized in Accounts & Finance. Couple with this, I have earned BS Sociology from renowned institute of Pakistan. Moreover, I have humongous teaching experience at Graduate and Post-graduate level to Business and humanities students along with more than 7 years of teaching experience to my foreign students Online. I’m also professional writer and write for numerous academic journals pertaining to educational institutes periodically.
4.90+
248+ Reviews
287+ Question Solved
Related Book For 

Question Posted:
Students also viewed these Mathematics questions
-
Create a column named Bonus and calculate the Bonus for all the rows using the following instructions: If the Sale Amount is greater than or equal to 15000, then the bonus will be 10% of the Sale...
-
Each row of data indicates the make of vehicles sold at auction in the US in 2010. The data table describes 1,884 vehicles. (a) Using software, tabulate the frequencies of the makes of cars. (b) What...
-
In this problem, you will process the November and December monthly payrolls for Warner Merchandising Co. You will perform the operating procedures necessary to add new employees, make changes to...
-
Assuming that the Fed judges inflation to be the most significant problem in the economy and that it wishes to employ all of its policy instruments except interest on reserves, what should the Fed do...
-
Air with a density () of 1 kg/m3 flows through a pipe of diameter 20 cm at a velocity of 10 m/s. Determine (a) The volume flow rate in L/min (b) Mass flow rate in kg/min. Use the PG flow state daemon...
-
Listed below are the weights in pounds of 11 players randomly selected from the roster of the Seattle Seahawks when they won Super Bowl XLVIII (the same players from the preceding exercise). Are the...
-
Describe the three approaches to releasing a product or implementing a system. AppendixLO1
-
Raymond P. Wirth signed a pledge agreement that stated that in consideration of his interest in education, and intending to be legally bound, he irrevocably pledged and promised to pay Drexel...
-
Assignment Gradebook ORION ent Chapter 5, Section 5.2, Question 007 Convert Q = 36(1.77)' to the form Q = aek, Enter you answer accurate to three decimal places for each parameter. Q= QE MESSAGE MY...
-
A collector of trading cards records the sale prices (in dollars) of a particular card on an online auction site, and puts the results in a stem-and-leaf plot: Answer the following questions about...
-
The bar graph shown gives data on 2020 model year cars available in the United States. Analyze the graph to answer the following questions. 1. What proportion of available cars were sports cars? 2....
-
Imagine a special air filter placed in a window of a house. The tiny holes in the filter allow only air molecules moving faster than a certain speed to exit the house, and allow only air molecules...
-
1.Think about your investment Possibility for 3 years holding period in real investment environment? A.What could be your investment objectives? B. What amount of fund you could invest for three...
-
3- The student council normally sells 1500 school T-shirts for $12 each. This year they plan to decrease the price of the T-shirts. Based on student feedback, they know that for every $0.50 decrease...
-
2. The notation {f(x): x S} means "the set of all values that can be produced by substituting an element x of set S into f(x)." For example, the set of all odd integers can be expressed as {2k+1kZ}....
-
Implementation guidance for IFRS 2 indicates that it "accompanies, but is not part of, IFRS 2." In other words, this implementation guidance is considered mandatory. integral to the standard. not...
-
2. (3 points) NextGames Inc. has a new video game cassette for the upcoming holiday season. It is 3 trying to determine the target cost for the game if the selling price per unit will be set at $130,...
-
Why would a manager prefer a decision tree instead of a decision table?
-
Find an equation of the given line. Slope is -2; x-intercept is -2
-
please help Problem 13-7 (Algo) Prepare a Statement of Cash Flows [LO13-1, LO13-2] [The following information applies to the questions displayed below.] Comparative financial statements for Weaver...
-
A firm has 1000 shareholders, each of whom own $59 in shares. The firm uses $28000 to repurchase shares. What percentage of the firm did each of the remaining shareholders own before the repurchase,...
-
Vancouver Bank agrees to lend $ 180,000 to Surrey Corp. on November 1, 2020 and the company signs a six-month, 6% note maturing on May 1, 2021. Surrey Corp. follows IFRS and has a December 31 fiscal...

Study smarter with the SolutionInn App


