

Question: The Bode plots for a plant, G(s), used in a unity feedback system are shown in Figure P10.7. Do the following: a. Find the gainmargin,
The Bode plots for a plant, G(s), used in a unity feedback system are shown in Figure P10.7. Do the following:
a. Find the gainmargin, phasemargin, zero dBfrequency, 180° frequency, and the closed-loop bandwidth.
b. Use your results in Part a to estimate the damping ratio, percent overshoot, settling time, and peak time.
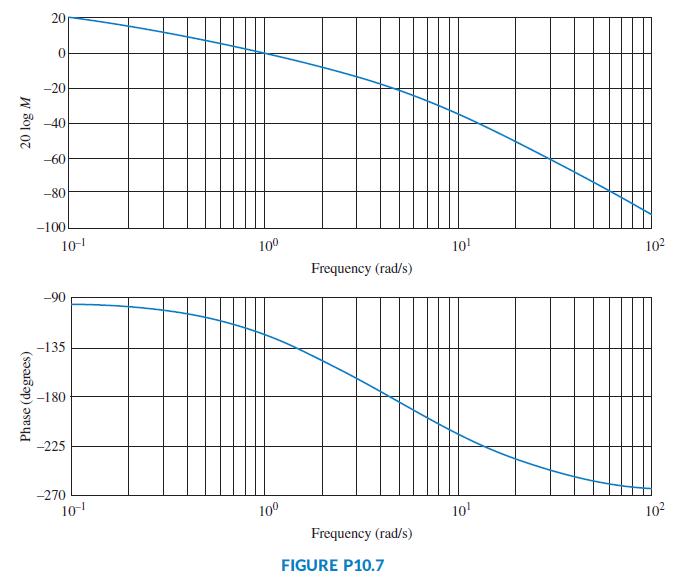
20 -20 -40 -60 -80 -100 10- 100 10! 102 Frequency (rad/s) -90 -135 -180 -225 -270 10 100 10' 102 Frequency (rad/s) FIGURE P10.7 Phase (degrees) 20 log M
Step by Step Solution
★★★★★
3.49 Rating (172 Votes )
There are 3 Steps involved in it
1 Expert Approved Answer
Step: 1 Unlock

Question Has Been Solved by an Expert!
Get step-by-step solutions from verified subject matter experts
Step: 2 Unlock
Step: 3 Unlock