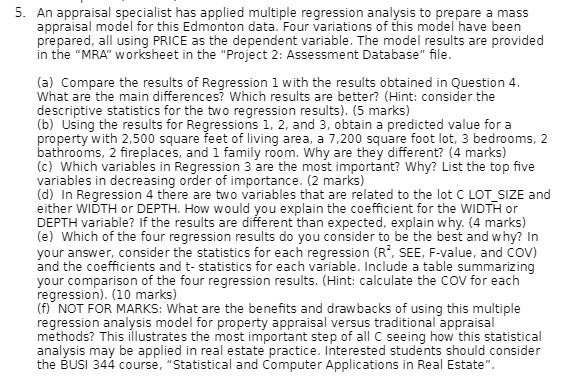
Question: 5. An appraisal specialist has applied multiple regression analysis to prepare a mass appraisal model for this Edmonton data. Four variations of this model have

5. An appraisal specialist has applied multiple regression analysis to prepare a mass appraisal model for this Edmonton data. Four variations of this model have been prepared, all using PRICE as the dependent variable. The model results are provided in the "MRA" worksheet in the "Project 2: Assessment Database" file. (a) Compare the results of Regression 1 with the results obtained in Question 4. What are the main differences? Which results are better? (Hint: consider the descriptive statistics for the two regression results). (5 marks) (b) Using the results for Regressions 1, 2, and 3, obtain a predicted value for a property with 2,500 square feet of living area, a 7,200 square foot lot, 3 bedrooms, 2 bathrooms, 2 fireplaces, and 1 family room. Why are they different? (4 marks) (c) Which variables in Regression 3 are the most important? Why? List the top five variables in decreasing order of importance. (2 marks) (d) In Regression 4 there are two variables that are related to the lot C LOT SIZE and either WIDTH or DEPTH. How would you explain the coefficient for the WIDTH or DEPTH variable? If the results are different than expected, explain why. (4 marks) (e) Which of the four regression results do you consider to be the best and why? In your answer, consider the statistics for each regression (R', SEE, F-value, and COV) and the coefficients and t- statistics for each variable. Include a table summarizing your comparison of the four regression results. (Hint: calculate the COV for each regression). (10 marks) (f) NOT FOR MARKS: What are the benefits and drawbacks of using this multiple regression analysis model for property appraisal versus traditional appraisal methods? This illustrates the most important step of all C seeing how this statistical analysis may be applied in real estate practice. Interested students should consider the BUSI 344 course, "Statistical and Computer Applications in Real Estate"
Step by Step Solution
There are 3 Steps involved in it

Get step-by-step solutions from verified subject matter experts


