Analysis of segmental data Swiss-based Nestl is the worlds largest food and beverage group with 2001 sales
Question:
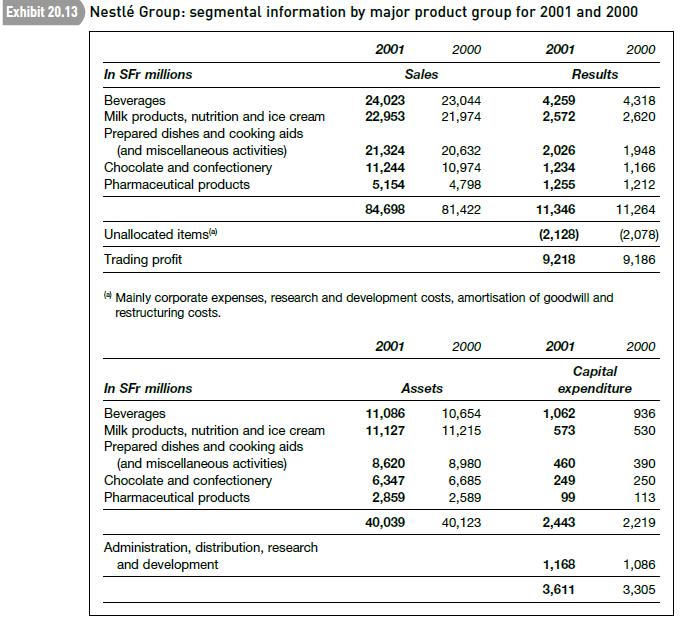
Analysis of segmental data Swiss-based Nestlé is the world’s largest food and beverage group with 2001 sales of SFr 85 billion. Its major brands include Nescafé, Perrier and Vittel in beverages and Maggi and Buitoni in prepared dishes.
However, it uses the Nestlé name in milk products, ice cream and confectionery.
Nestlé follows IAS. Under ‘Accounting policies’, it defines its primary and secondary segment formats:
(Amounts in B million) x9 x8 Net income in accordance with Euroland GAAP 526 383 Adjustments to reported net income with respect to:
Goodwill (103) (67)
Pension costs 5 (8)
Property revaluation 3 3 Provisions (29) (46)
Deferred tax effect of adjustments 7 12 Net income in accordance with US GAAP 409 277
(Amounts in B million) End-x9 End-x8 Shareholders’ equity in accordance with Euroland GAAP 1,646 1,207 Adjustments to reported shareholders’ equity with respect to:
Goodwill 3,994 3,412 Pension liabilities 34 39 Property revaluation (21) (24)
Long-term provisions 20 23 Shareholders’ equity in accordance with US GAAP 5,673 4,657 Exhibit 20.12 Helping Hand: reconciliation of x9 income and equity to US GAAP 690 PART 3 • PERSPECTIVES The primary segment format – by management responsibilities and geographic area – represents the Group’s management structure. The principal activity of the Group is the food business, which is managed along three geographic zones. The other activities, mainly pharmaceutical products and water, are managed on a worldwide basis. The secondary segment format representing products is divided into five categories (segments).
(Nestlé, Management Report 2001)
Exhibit 20.13 shows the information Nestlé discloses under the secondary segment format.
Required
(a) Determine which product group in 2001:
(i) enjoyed the fastest sales growth;
(ii) earned the highest margin on sales;
(iii) was the most asset-intensive;
(iv) earned the lowest return on assets.
b) An analyst reviewing Nestlé’s product group disclosures questioned their usefulness. ‘A key expenditure is research and development which, according to the consolidated income statement, totalled SFr 1,162 million in 2001. Nestlé doesn’t break down this figure by product group so the segmental profit and investment numbers are misleading.’ Comment on this criticism. Do you agree?
(c) Nestlé publishes additional information under its primary segment format, in particular, liabilities and depreciation by segment. The capex and depreciation figures are shown below:
Capital Depreciation expenditure of property, plant and equipment (In SFr millions) 2001 2000 2001 2000 Food:
Europe 954 946 806 890 Americas 747 766 695 767 Africa, Asia, Oceania 626 550 438 481 Other activities 1,169 949 558 519 3,496 3,211 2,497 2,657 Corporate and R&D 115 94 84 80 3,611 3,305 2,581 2,737 On comparing the capex and depreciation figures, an investor asks: ‘The depreciation charge on Nestlé’s food assets fell in every area between 2000 and 2001. Yet in Africa, Asia and Oceania and, to a lesser extent, in Europe, food capex rose between these two years. How can this be?’
Suggest possible reasons why the depreciation charge on a segment’s fixed assets might decline in a period when expenditure on property, plant and equipment in that segment increases.AppenedixLO1
Step by Step Answer:


