

Figure 9.8 shows a typical cost-volume-profit chart: Required: (a) Explain to a colleague who is not an
Question:
Figure 9.8 shows a typical cost-volume-profit chart:
Required:
(a) Explain to a colleague who is not an accountant the reasons for the change in result on this cost-volume-profit chart from a loss at point
(a) to a profit at point (b). (3 marks)
(b) Identify and critically examine the underlying assumptions of this type of cost-volume—
profit analysis and consider whether such analyses are useful to the management of an organization.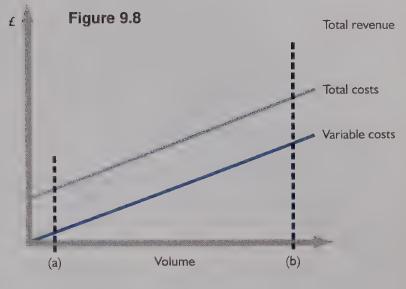
Fantastic news! We've Found the answer you've been seeking!
Step by Step Answer:

Answered By
Cyrus Sandoval
I a web and systems developer with a vast array of knowledge in many different front end and back end languages, responsive frameworks, databases, and best code practices. My objective is simply to be the best web developer that i can be and to contribute to the technology industry all that i know and i can do. My skills include:
- Front end languages: css, HTML, Javascript, XML
- Frameworks: Angular, Jquery, Bootstrap, Jasmine, Mocha
- Back End Languages: Java, Javascript, PHP,kotlin
- Databases: MySQL, PostegreSQL, Mongo, Cassandra
- Tools: Atom, Aptana, Eclipse, Android Studio, Notepad++, Netbeans.
Having a degree in Computer Science enabled me to deeply learn most of the things regarding programming, and i believe that my understanding of problem solving and complex algorithms are also skills that have and will continue to contribute to my overall success as a developer.
I’ve worked on countless freelance projects and have been involved with a handful of notable startups. Also while freelancing I was involved in doing other IT tasks requiring the use of computers from working with data, content creation and transcription.
1+ Reviews
10+ Question Solved
Related Book For 

Question Posted:
