

Four lines representing expected costs and revenue have been drawn on the following break-even chart: Which statement
Question:
Four lines representing expected costs and revenue have been drawn on the
following break-even chart:
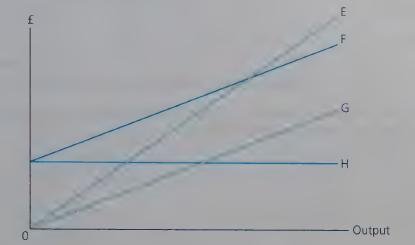
Which statement is correct?
(a) Line F represents total variable cost.
(b) The break-even point occurs at the intersection of lines E and F.
(c) Line G represents total revenue.
(d) The break-even point occurs at the intersection of lines G and H.
(2 marks)
ACCA Financial Information for Management
Fantastic news! We've Found the answer you've been seeking!
Step by Step Answer:

Answered By
AJIN KURIAKOSE
I HAVE ELECTRONICS ENGINEERING DEGREE..AND MY AREA OF INTEREST IS MATHEMATICS,CONTROL SYSTEM,NETWORK,DIGITAL
21+ Reviews
32+ Question Solved
Related Book For 
Question Posted:
