

Refer to Problem 16-12. As part of its environmental cost reporting system, Limon tracks its total environmental
Question:
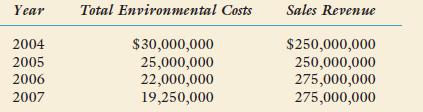
Refer to Problem 16-12. As part of its environmental cost reporting system, Limon tracks its total environmental costs. Consider the following cost and sales data:
Required:
1. Prepare a bar graph for environmental costs expressed as a percentage of sales.
Assuming that environmental performance has improved, explain why environmental costs have decreased.
2. Normalize energy consumption by expressing it as a percentage of sales. Now, prepare a bar graph for energy. Comment on the progress made in reducing energy consumption. How does this compare with the conclusion that would be reached using a nonnormalized measure of progress? Which is the best approach? Explain.
Step by Step Answer:

This question has not been answered yet.
You can Ask your question!

Cost Management Accounting And Control
ISBN: 9780324233100
5th Edition
Authors: Don R. Hansen, Maryanne M. Mowen
