

Exercise 6.10 showed a plot of length versus height for 147 male guppies with a least squares
Question:
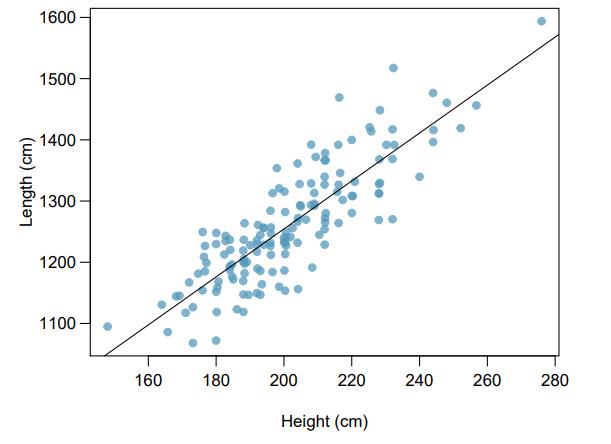
Exercise 6.10 showed a plot of length versus height for 147 male guppies with a least squares regression line.
(a) Identify two points that have relatively high leverage and discuss whether these points seem to be particularly influential.
(b) Based on the plot, comment on whether it is appropriate to use \(R^{2}\) as a metric for describing the strength of the model fit.
(c) The \(R^{2}\) for this model is 0.718 . Interpret this value in the context of the data.
Data From Exercise 6.10
Step by Step Answer:

This question has not been answered yet.
You can Ask your question!
Related Book For 

Introductory Statistics For The Life And Biomedical Sciences
ISBN: 9781943450121
1st Edition
Authors: Julie Vu, David Harrington
Question Posted:
