

The residual plots below are for the linear model fit in Exercise 6.10 predicting length from height
Question:
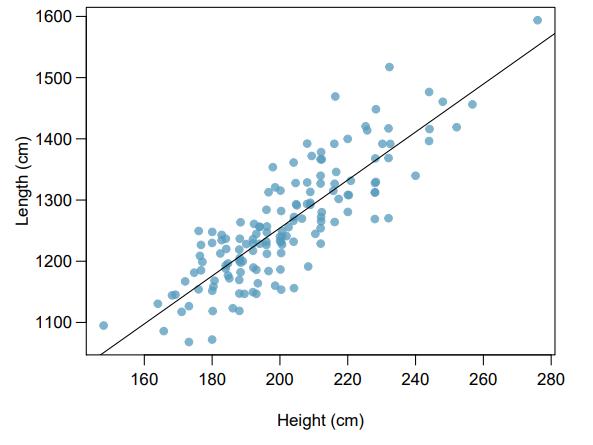
The residual plots below are for the linear model fit in Exercise 6.10 predicting length from height for 147 male guppies.
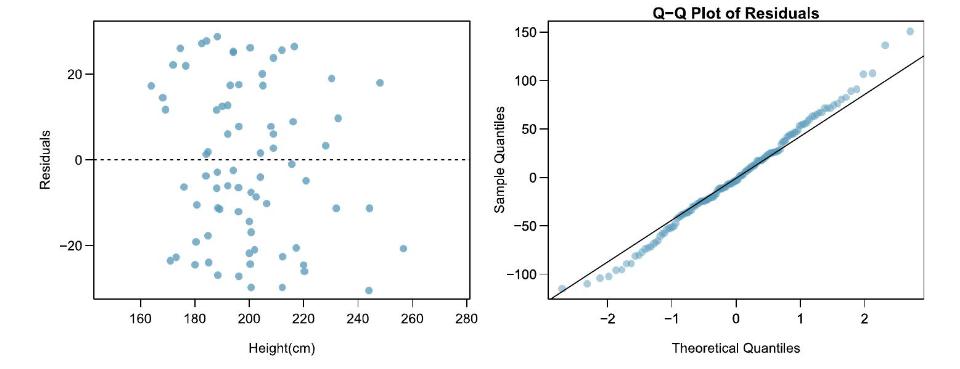
(a) From a plot of residual values versus predicted values, are the assumptions of linearity and constant variability satisfied? Explain your answer.
(b) Is it reasonable to assume that the observations were independent, based on the description of the study? Explain your answer.
(c) Are the residuals approximately normally distributed? Explain your answer.
Data From Exercise 6.10
Step by Step Answer:

This question has not been answered yet.
You can Ask your question!
Related Book For 

Introductory Statistics For The Life And Biomedical Sciences
ISBN: 9781943450121
1st Edition
Authors: Julie Vu, David Harrington
Question Posted:
