

Some students take part in an obstacle race. The time it took each student to complete the
Question:
Some students take part in an obstacle race. The time it took each student to complete the race was noted. The results are shown in the histogram.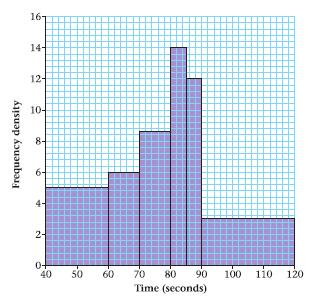
a Give a reason to justify the use of a histogram to represent these data. The number of students who took between 60 and 70 seconds is 90. b Find the number of students who took between 40 and 60 seconds. c Find the number of students who took 80 seconds or less. d Calculate the total number of students who took part in the race.
AppendixLO1
Fantastic news! We've Found the answer you've been seeking!
Step by Step Answer:

Answered By
Sinmon Warui Kamau
After moving up and down looking for a job, a friend introduced me to freelance writing. I started with content writing and later navigated to academic writing. I love writing because apart from making a living out of it, it is also a method of learning and helping others to learn.
40+ Reviews
45+ Question Solved
Related Book For 

Edexcel As And A Level Modular Mathematics Statistics 1
ISBN: 978-0435519124
1st Edition
Authors: Keith Pledger Et Al
Question Posted:
