15.3 The data series for the prices of crude oil, copper, and lumber are printed in Table...
Question:
15.3 The data series for the prices of crude oil, copper, and lumber are printed in Table 15.4.
TABLE 15.4 PRICES OF CRUDE OIL, COPPER, AND LUMBER (in 1967 constant dollars) Obs. Oil Copper Lumber Obs. Oil Copper Lumber 1870 8.64 41.61 9.13 1929 3.63 36.86 32.65 1871 10.16 47.54 9.70 1930 3.64 29.21 29.84 1872 8.35 70.64 9.75 1931 2.47 21.54 29.39 1873 4.24 61.57 9.98 1932 3.50 16.77 25.42 1874 2.81 54.68 9.93 1933 2.71 20.59 24.97 1875 3.37 53.37 9.45 1934 3.52 21.76 24.97 1876 6.90 49.60 9.60 1935 3.17 20.82 23.51 1877 6.95 51.15 9.74 1936 3.48 22.78 24.34 1878 3.74 47.17 9.75 1937 3.55 29.66 25.12 1879 2.84 49.50 10.43 1938 3.66 24.69 24.59 1880 2.80 52.68 10.09 1939 3.32 27.71 26.55 1881 2.74 46.39 10.90 1940 3.26 27.90 25.38 1882 2.26 49.85 11.11 1941 3.28 26.16 27.47 1883 3.27 42.64 11.05 1942 3.01 23.18 29.98 1884 2.66 41.67 11.79 1943 2.89 22.18 39.74 1885 2.95 35.62 12.02 1944 2.91 22.01 38.76 1886 2:42 32.53 12.32 1945 2.89 21.61 37.78 1887 2.44 31.96 12.44 1946 2.92 22.12 45.31 1888 2.97 52.03 12.03 1947 3.27 27.45 52.84 1889 3.18 45.61 12.03 1948 4.09 26.57 48.76 1890 3.00 52.41 12.28 1949 4.19 24.40 53.94 1891 2.33 43.75 12.19 1950 4.05 25.92 52.30 1892 2.08 41.26 12.60 1951 3.67 26.56 46.18 1893 2.44 38.18 12.55 1952 3.77 27.34 51.13 1894 3.24 36.84 13.72 1953 4.07 32.99 52.86 1895 4.90 41.43 13.07 1954 4.21 33.94 54.91 1896 4.58 44.17 13.67 1955 4.18 42.71 55.48 1897 3.17 45.42 13.17 1956 4.09 46.09 54.20 1898 3.64 46.00 13.32 1957 4.38 31.73 50.88 1899 4.80 63.20 13.68 1958 4.23 27.27 48.78 1900 4.72 55.17 12.59 1959 4.11 32.95 51.24 1901 4.00 57.19 12.53 1960 4.07 33.83 52.57 1902 3.59 38.16 13.95 1961 4.10 31.64 50.89 1903 4.04 43.00 13.42 1962 4.10 32.28 49.43 1904 3.83 40.91 11.95 1963 4.11 32.38 50.03 1905 2.90 49.03 13.77 1964 4.09 33.79 51.58 1906 2.66 60.50 15.80 1965 3.99 36.23 52.09 1907 2.50 59.52 16.01 1966 3.89 36.27 50.46 1908 2.50 40.74 20.49 1967 3.90 38.20 51.17 1909 2.18 37.36 20.17 1968 3.83 40.78 53.99 1910 1.85 34.99 18.29 1969 3.90 44.60 57.65 1911 2.03 37.01 22.12 1970 3.89 52.26 49.09 1912 2.39 45.79 20.98 1971 4.00 45.13 57.88 1913 3.19 42.50 23.25 1972 3.84 42.49 65.20 1914 2.79 38.75 22.56 1973 3.99 43.73 74.21 1915 2.20 48.19 22.95 1974 5.56 46.81 50.57 1916 3.22 61.68 18.98 1975 5.64 35.11 45.27 1917 3.42 44.88 16.34 1976 5.82 36.22 52.35 1918 3.90 36.34 16.51 1977 5.71 32.48 57.54 1919 3.90 26.15 17.86 1978 5.61 30.23 64.23 1920 5.40 21.96 19.15 1979 6.98 37.77 62.77 1921 4.39 24.85 22.84 1980 10.34 35.99 41.17 1922 4.21 26.85 22.53 1981 13.94 27.22 32.09 1923 3.24 27.75 21.91 1982 12.34 23.37 27.71 1924 3.58 25.69 26.13 1983 11.26 24.80 37.21 1925 4.10 26.22 31.33 1984 10.86 20.76 28.27 1926 4.67 26.74 29.94 1985 10.15 20.47 27.58 1927 3.50 26.22 30.12 1986 5.46 20.91 35.70 1928 3.37 29.26 26.75 1987 6.57 25.61 39.91
(a) Calculate the sample autocorrelation function for each series, and determine whether they are consistent with the Dickey-Fuller test results in Example
Step by Step Answer:

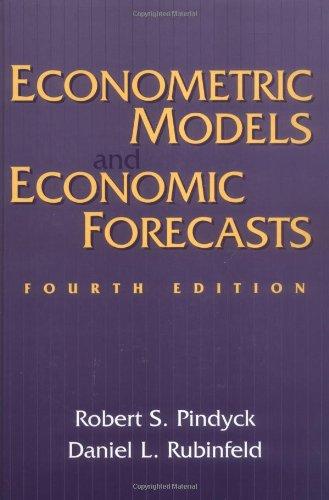
Econometric Models And Economic Forecasts
ISBN: 9780079132925
4th Edition
Authors: Robert Pindyck, Daniel Rubinfeld


