In 2003, Ray Fair analyzed the relationship between stock prices and risk aversion by looking at the
Question:
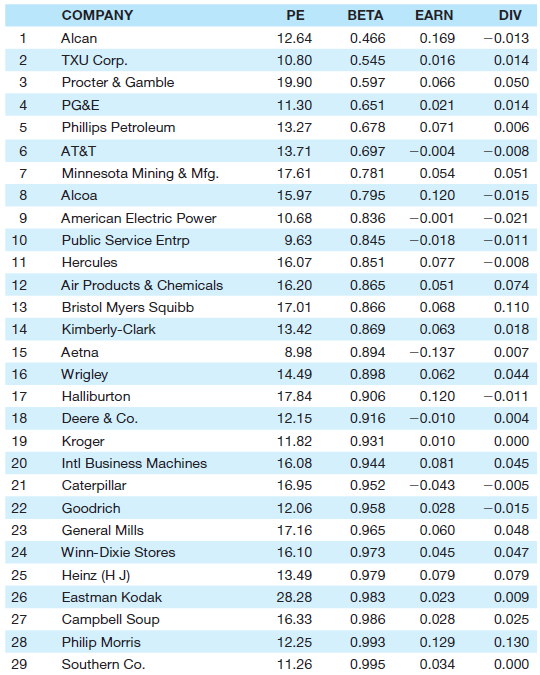
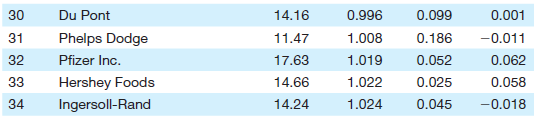
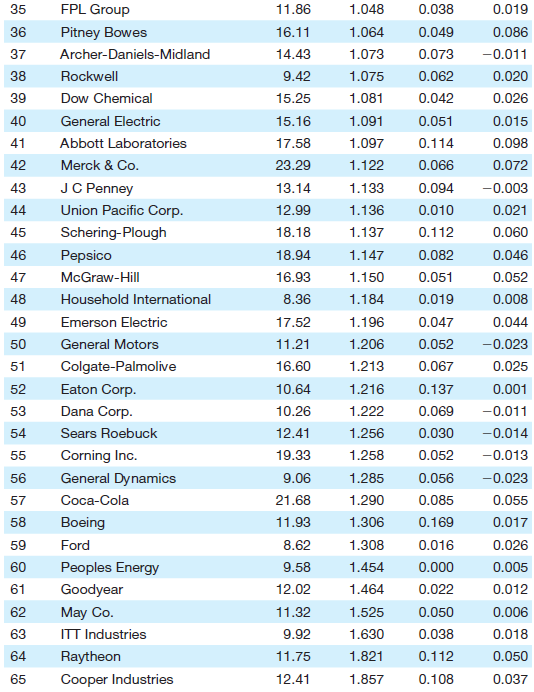
In 2003, Ray Fair analyzed the relationship between stock prices and risk aversion by looking at the 1996–2000 performance of the 65 companies that had been a part of Standard and Poor’s famous index (the S&P 500) since its inception in 1957. Fair focused on the P/E ratio (the ratio of a company’s stock price to its earnings per share) and its relationship to the beta coefficient (a measure of a company’s riskiness—a high beta implies high risk). Hypothesizing that the stock price would be a positive function of earnings growth and dividend growth, he estimated the following equation:
Where:
LNPEi = the log of the median P/E ratio of the ith company from 1996 to 2000
BETAi = the mean beta coefficient of the ith company from 1958 to 1994
EARNi = the median percentage earnings growth rate for the ith company from 1996 to 2000
DIVi = the median percentage dividend growth rate for the ith company from 1996 to 2000
a. Create and test appropriate hypotheses about the slope coefficients of this equation at the 5-percent level.
b. One of these variables is lagged and yet this is a cross-sectional equation. Explain which variable is lagged and why you think Fair lagged it.
c. Is one of Fair’s variables potentially irrelevant? Which one? Use Stata, EViews, or your own regression program on the data in Table 7.2 to estimate Fair’s equation without your potentially irrelevant variable and then use our four specification criteria to determine whether the variable is indeed irrelevant.
Table 7.2 Data for the Stock Price Example
d. What functional form does Fair use? Does this form seem appropriate on the basis of theory?
e. Suppose that your review of the literature makes you concerned that Fair should have used a double-log functional form for his equation. Use the data in Table 7.2 to estimate that functional form on Fair’s data. What is your estimated result? Does it support your concern? Explain.
Step by Step Answer: