Question:
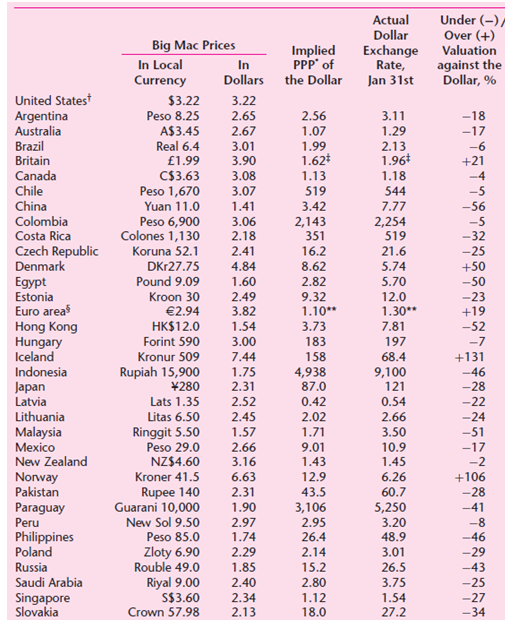
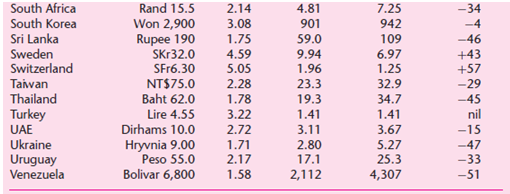
Since 1986 the Economist has been publishing the Big Mac Index as a crude, and hilarious, measure of whether international currencies are at their €œcorrect€ exchange rate, as judged by the theory of purchasing power parity (PPP). The PPP holds that a unit of currency should be able to buy the same bundle of goods in all countries. The proponents of PPP argue that, in the long run, currencies tend to move toward their PPP. The Economist uses McDonald€™s Big Mac as a representative bundle and gives the information in following table.


Consider the following regression model:
Yi = β1 + β2Xi + ui
where Y = actual exchange rate and X = implied PPP of the dollar.
a. If the PPP holds, what values of β1 and β2 would you expect a priori?
b. Do the regression results support your expectation? What formal test do you use to test your hypothesis?
c. Should the Economist continue to publish the Big Mac Index? Why or why not?
Transcribed Image Text:
Under (-)/ Over (+) Valuation Actual Dollar Big Mac Prices In Local Currency Implied PPP" of Exchange Rate, Jan 31st In Dollars the Dollar against the Dollar, % United Statest $3.22 3.22 2.65 2.67 3.01 3.90 3.08 Argentina Australia Peso 8.25 A$3.45 Real 6.4 2.56 1.07 3.11 1.29 2.13 1.96* 1.18 -18 -17 -6 +21 -4 -5 Brazil 1.99 1.62* 1.13 Britain £1.99 C$3.63 Peso 1,670 Canada Chile 3.07 1.41 519 3.42 544 7.77 China Colombia Costa Rica Yuan 11.0 -56 Peso 6,900 Colones 1,130 3.06 2.18 2.41 4.84 2,143 351 16.2 8.62 2.82 2,254 519 21.6 5.74 5.70 -5 -32 -25 +50 -50 Czech Republic Denmark Koruna 52.1 DKr27.75 Pound 9.09 Egypt Estonia 1.60 2.49 3.82 Kroon 30 9.32 1.10** 3.73 12.0 1.30** 7.81 -23 +19 Euro area Hong Kong Hungary Iceland Indonesia €2.94 HK$12.0 Forint 590 1.54 -52 3.00 183 197 -7 Kronur 509 7.44 158 68.4 +131 Rupiah 15,900 1.75 2.31 2.52 4,938 9,100 121 -46 -28 -22 -24 Japan Latvia Lithuania ¥280 87.0 Lats 1.35 0.42 0.54 2.66 Litas 6.50 2.45 2.02 1.71 9.01 1.43 Malaysia Mexico New Zealand Ringgit 5.50 Peso 29.0 NZ$4.60 1.57 2.66 3.50 10.9 1.45 6.26 60.7 5,250 3.20 -51 -17 3.16 -2 Norway Pakistan Paraguay Peru Philippines Poland Russia Saudi Arabia Kroner 41.5 6.63 2.31 1.90 12.9 +106 43.5 3,106 2.95 -28 Rupee 140 Guarani 10,000 -41 New Sol 9.50 Peso 85.0 2.97 -8 -46 1.74 26.4 48.9 3.01 26.5 Zloty 6.90 Rouble 49.0 2.29 2.14 15.2 -29 -43 -25 1.85 Riyal 9.00 S$3.60 Crown 57.98 2.40 2.80 3.75 -27 -34 Singapore Slovakia 2.34 2.13 1.12 1.54 18.0 27.2 South Africa Rand 15.5 Won 2,900 Rupee 190 4.81 901 59.0 9.94 1.96 23.3 19.3 7.25 942 109 6.97 1.25 32.9 34.7 1.41 3.67 5.27 25.3 4,307 2.14 3.08 1.75 4.59 5.05 2.28 -34 South Korea Sri Lanka Sweden Switzerland Taiwan Thailand Turkey -4 -46 +43 +57 SKr32.0 SF16.30 NT$75.0 -29 -45 Baht 62.0 Lire 4.55 Dirhams 10.0 Hryvnia 9.00 Peso 55.0 Bolivar 6,800 1.78 3.22 nil 1.41 3.11 2.80 2.72 UAE Ukraine Uruguay Venezuela -15 -47 -33 -51 1.71 2.17 1.58 17.1 2,112


