

Question: Table 1.3 gives data on the Consumer Price Index (CPI) for seven industrialized countries with 19821984 = 100 as the base of the index. a.
Table 1.3 gives data on the Consumer Price Index (CPI) for seven industrialized countries with 1982€“1984 = 100 as the base of the index.
a. From the given data, compute the inflation rate for each country.
b. Plot the inflation rate for each country against time (i.e., use the horizontal axis for time and the vertical axis for the inflation rate).
c. What broad conclusions can you draw about the inflation experience in the seven countries?
d. Which country€™s inflation rate seems to be most variable? Can you offer any explanation?
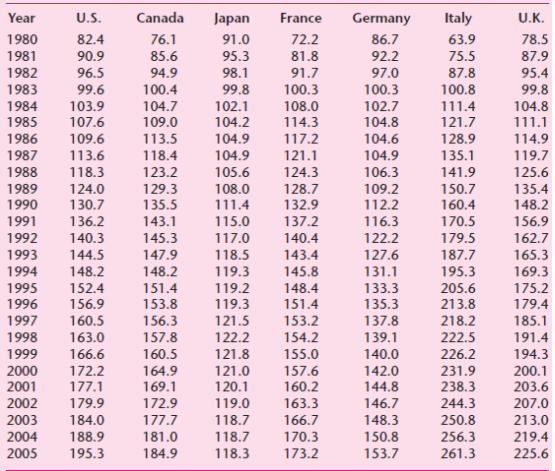
Subtract from the current year€™s CPI the CPI from the previous year, divide the difference by the previous year€™s CPI, and multiply the result by 100. Thus, the inflation rate for Canada for 1981 is [(85.6 ˆ’ 76.1)/76.1] × 100 = 12.48% (approx.).
Canada Germany Italy U.K. Year U.S. Japan France 82.4 76.1 72.2 63.9 1980 91.0 86.7 78.5 81.8 91.7 1981 90.9 85.6 95.3 92.2 75.5 87.9 96.5 94.9 100.4 98.1 87.8 1982 97.0 95.4 1983 99.6 99.8 100.3 100.3 100.8 99.8 1984 103.9 104.7 102.1 108.0 102.7 111.4 104.8 109.0 111.1 1985 107.6 104.2 114.3 104.8 121.7 104.9 104.9 105.6 1986 109.6 113.5 117.2 104.6 128.9 114.9 1987 1988 113.6 121.1 135.1 118.4 104.9 119.7 118.3 123.2 124.3 106.3 141.9 125.6 108.0 111.4 124.0 130.7 128.7 132.9 137.2 109.2 112.2 150.7 160.4 1989 129.3 135.4 1990 135.5 148.2 1991 136.2 143.1 115.0 116.3 170.5 156.9 117.0 162.7 1992 140.3 145.3 140.4 122.2 179.5 144.5 148.2 118.5 127.6 131.1 165.3 169.3 1993 147.9 143.4 187.7 1994 148.2 119.3 145.8 195.3 119.2 1995 152.4 151.4 148.4 133.3 205.6 175.2 213.8 1996 156.9 153.8 119.3 151.4 135.3 179.4 1997 156.3 121.5 153.2 137.8 218.2 185.1 160.5 122.2 1998 163.0 157.8 154.2 139.1 222.5 191.4 1999 2000 2001 2002 166.6 160.5 121.8 155.0 140.0 142.0 144.8 226.2 231.9 238.3 244.3 194.3 172.2 177.1 121.0 164.9 157.6 200.1 203.6 207.0 169.1 120.1 160.2 179.9 172.9 119.0 163.3 146.7 2003 184.0 177.7 118.7 166.7 148.3 150.8 250.8 213.0 219.4 2004 118.7 170.3 256.3 188.9 181.0 153.7 2005 195.3 184.9 118.3 173.2 261.3 225.6
Step by Step Solution
3.41 Rating (170 Votes )
There are 3 Steps involved in it
a These rates are as follows They are yearoveryear starting with 1981 b c As you can see fr... View full answer

Get step-by-step solutions from verified subject matter experts
Document Format (2 attachments)
1529_605d88e1ca1bc_656040.pdf
180 KBs PDF File
1529_605d88e1ca1bc_656040.docx
120 KBs Word File