

Question: Table 3.8 gives data on gross domestic product (GDP) for the United States for the years 1959 2005. a. Plot the GDP data in current
Table 3.8 gives data on gross domestic product (GDP) for the United States for the years 1959 2005.
a. Plot the GDP data in current and constant (i.e., 2000) dollars against time.
b. Letting Y denote GDP and X time (measured chronologically starting with 1 for 1959, 2 for 1960, through 47 for 2005), see if the following model fits the GDP data:
Yt = β1 + β2 Xt + ut
Estimate this model for both current and constant-dollar GDP.
c. How would you interpret β2?
d. If there is a difference between β2 estimated for current-dollar GDP and that estimated for constant-dollar GDP, what explains the difference?
Table 3.8
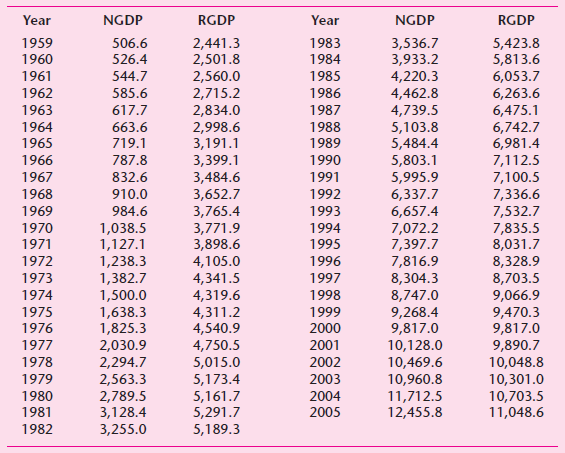
Year NGDP RGDP Year NGDP RGDP 2,441.3 2,501.8 2,560.0 2,715.2 2,834.0 2,998.6 3,191.1 3,399.1 3,484.6 3,652.7 3,765.4 3,771.9 3,898.6 4,105.0 4,341.5 4,319.6 4,311.2 4,540.9 4,750.5 5,015.0 5,173.4 5,161.7 5,291.7 5,189.3 1959 506.6 1983 3,536.7 3,933.2 4,220.3 4,462.8 4,739.5 5,103.8 5,484.4 5,803.1 5,995.9 6,337.7 6,657.4 7,072.2 7,397.7 7,816.9 8,304.3 8,747.0 9,268.4 9,817.0 10,128.0 10,469.6 10,960.8 11,712.5 12,455.8 5,423.8 5,813.6 6,053.7 6,263.6 6,475.1 6,742.7 6,981.4 7,112.5 7,100.5 7,336.6 7,532.7 7,835.5 8,031.7 8,328.9 8,703.5 9,066.9 9,470.3 9,817.0 9,890.7 10,048.8 10,301.0 10,703.5 11,048.6 1960 526.4 1984 1961 544.7 1985 1962 1986 585.6 1987 1963 617.7 1988 1964 663.6 1965 719.1 1989 1966 787.8 1990 1991 1967 832.6 1968 910.0 1992 1969 984.6 1993 1970 1,038.5 1,127.1 1,238.3 1,382.7 1,500.0 1,638.3 1,825.3 2,030.9 2,294.7 2,563.3 2,789.5 3,128.4 3,255.0 1994 1971 1995 1972 1996 1973 1997 1974 1998 1975 1999 1976 2000 1977 2001 1978 2002 1979 2003 1980 2004 1981 2005 1982
Step by Step Solution
3.41 Rating (160 Votes )
There are 3 Steps involved in it
a The plot is as follows where NGDP and RGDP are nominal and real GDP b NGDPt 496268 25258 Year s... View full answer

Get step-by-step solutions from verified subject matter experts
Document Format (2 attachments)
1529_605d88e1cba73_656147.pdf
180 KBs PDF File
1529_605d88e1cba73_656147.docx
120 KBs Word File