

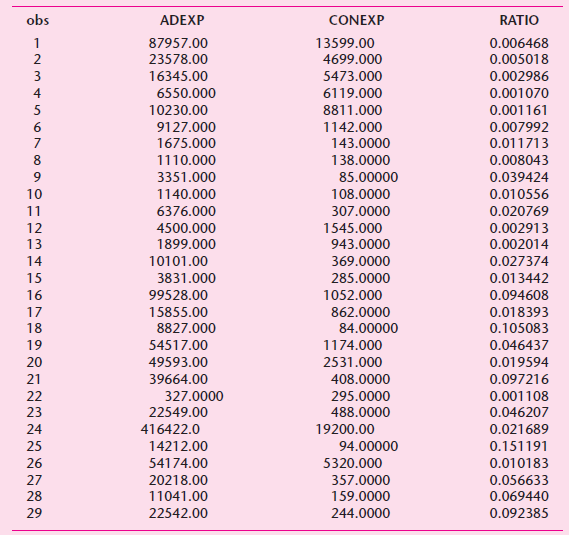
The following table gives data for the U.K. on total consumer expenditure (in £ millions) and advertising
Question:
a. Considering the various functional forms we have discussed in the chapter, which functional form might fit the data given in above table?
b. Estimate the parameters of the chosen regression model and interpret your results.
c. If you take the ratio of advertising expenditure to total consumer expenditure, what do you observe? Are there any product categories for which this ratio seems unusually high? Is there anything special about these product categories that might explain the relatively high expenditure on advertising?
Fantastic news! We've Found the answer you've been seeking!
Step by Step Answer:
a The scattergram of total consumer expenditure and advertising expenditure is as follows b Although ...View the full answer

Answered By
Nazrin Ziad
I am a post graduate in Zoology with specialization in Entomology.I also have a Bachelor degree in Education.I posess more than 10 years of teaching as well as tutoring experience.I have done a project on histopathological analysis on alcohol treated liver of Albino Mice.
I can deal with every field under Biology from basic to advanced level.I can also guide you for your project works related to biological subjects other than tutoring.You can also seek my help for cracking competitive exams with biology as one of the subjects.
2+ Reviews
10+ Question Solved
Related Book For 

Question Posted:
