

Suppose that the table at the top right shows an economys relationship between real output and the
Question:
Suppose that the table at the top right shows an economy’s relationship between real output and the inputs needed to produce that output: LO3
a. What is productivity in this economy?
b. What is the per-unit cost of production if the price of each input unit is $2?
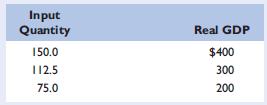
c. Assume that the input price increases from $2 to $3 with no accompanying change in productivity. What is the new per-unit cost of production? In what direction would the $1 increase in input price push the economy’s aggregate supply curve? What effect would this shift of aggregate supply have on the price level and the level of real output?
d. Suppose that the increase in input price does not occur but, instead, that productivity increases by 100 percent.
What would be the new per-unit cost of production?
What effect would this change in per-unit production cost have on the economy’s aggregate supply curve?
What effect would this shift of aggregate supply have on the price level and the level of real output?
Step by Step Answer:


Economics Principles Problems And Policies
ISBN: 9780073511443
19th Edition
Authors: Campbell Mcconnell ,Stanley Brue ,Sean Flynn
